Decred Blockchain Analysis - Part 3
A Tale of Two Ticket Pools
This report applies address clustering to all the tickets in the pool at certain block heights, the aim is to explore what kind of information can be summarised about the makeup of the ticket pool - questions like how many entities are operating there and how much of the activity is being obfuscated by mixing. I have selected two blocks and will profile the ticket pool at each block height, as well as giving an account of how staking clusters voted.
The aim is to build up a picture of which entities were actively staking their DCR with available address clustering techniques, and consider whether the picture these metrics paint has indicated any significant change in the interim period. This is intended to be part of building up a more comprehensive history of the Decred chain that will come later.
The block heights I selected are 485,000 (Sep 15 2020) and 525,000 (Feb 1 2021). The intervening period saw a significant increase in the ticket price and an increase in Politeia vote participation rates, and this is why I selected these block heights. I was hoping to turn the analysis around quite quickly but along the way it 1) highlighted major errors in the new clustering code I wrote and 2) gave me a way to track down the source of those errors. I wrote this adventure up in its own mini-report, probably only of interest to people who are very keen to understand the clustering and the kind of issues there are with it.
tl;dr about 1% of the tickets are still being assigned to a cluster that isn’t real, it joins together a VSP operator and the VSP’s users’ addresses. Everything else looks much more solid, in the Politeia era at least (more below).
Who’s in the pool?

What we’re interested in here is the people buying and voting tickets, but the closest we can get to that is an entity that controls a cluster of addresses. So the first question to ask is, how many different entities are there in the ticket pool?
At block 485,000, I count 22,239 distinct entities - however, most (21,262) of these entities are only associated with one ticket each. While some of these entities will be users with a single ticket, users who participate in Stake Shuffle mixing also look like this but may control many tickets.
There is a portion of the ticket pool which operates in the clear and can be tracked, and a portion which mixes and can only be considered in aggregate. I find it easiest to deal with these sets separately, so let’s begin with the set of mixed tickets.
Shuffled Stake
19,125 of the block 485,000 tickets were bought with mixed inputs (47%), so there’s not much to say about those except whether and how they voted.
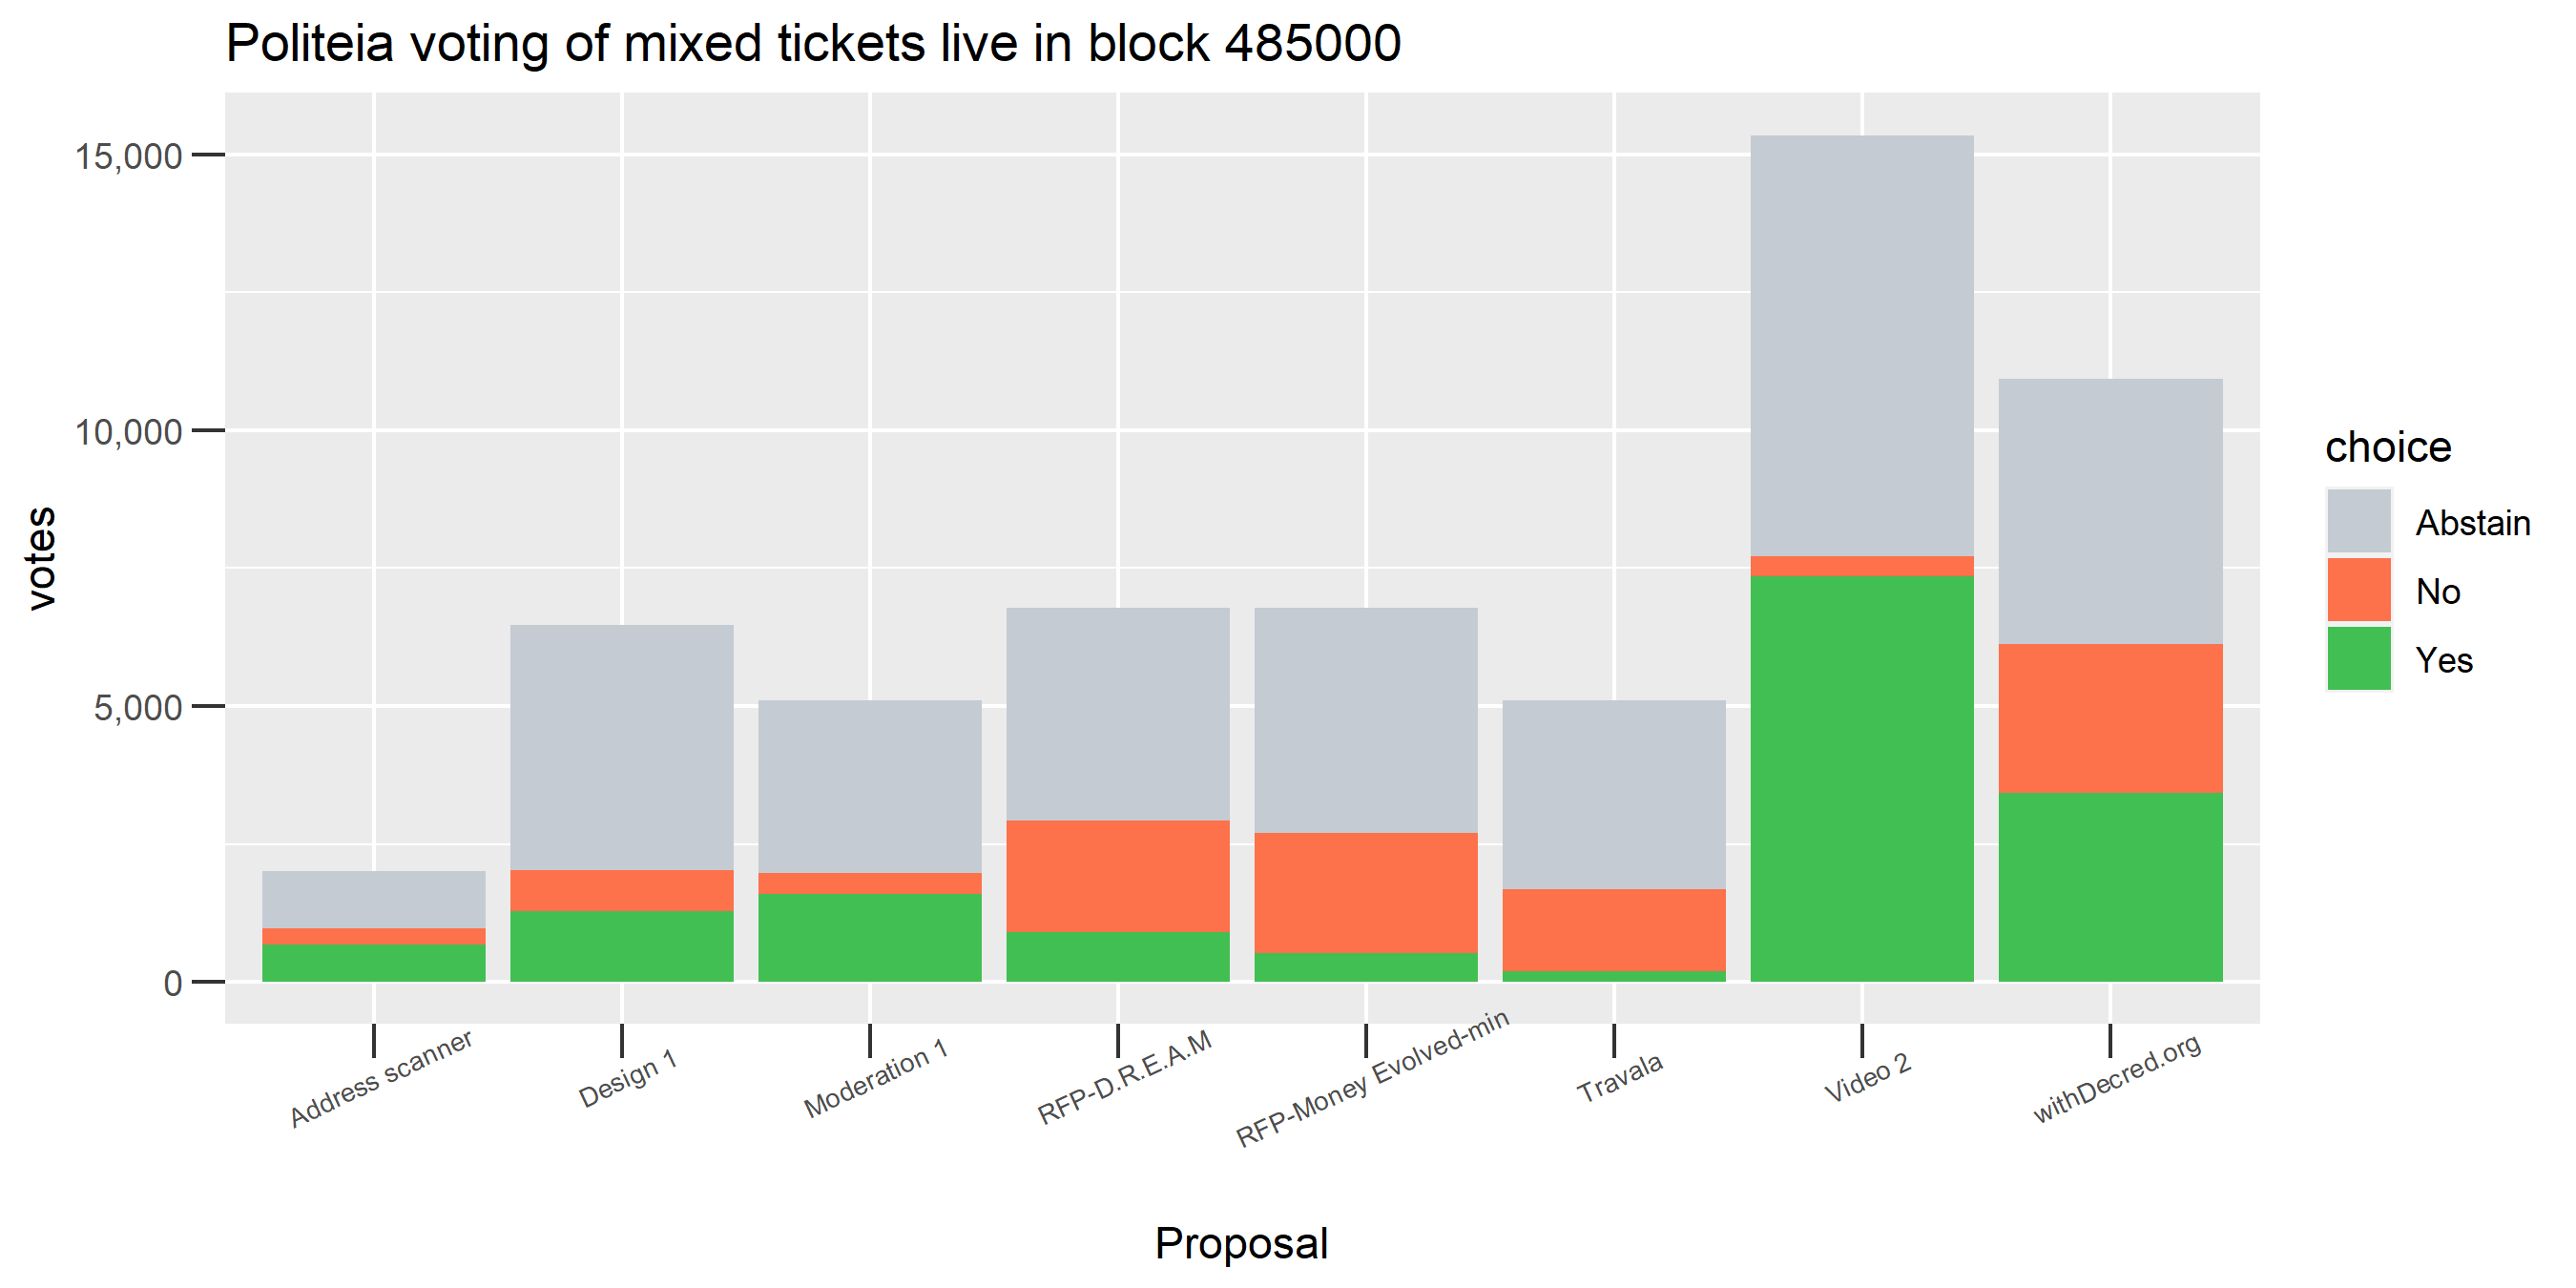
Block 485,000 Mixed Tickets Politeia Voting
These seem broadly in line with the proposal voting outcomes, so looks like the mixed tickets were voting similarly to the unmixed tickets.
Each ticket has its own variable lifecycle, from when it is bought to when it is selected to vote randomly or expires after 142 days. A ticket can vote on every Politeia proposal which comes to a vote while the ticket is live. When taking a snapshot of the ticket pool the tickets in it will be of varying age and voting history, so I have opted to exclude proposals for which the set of tickets had very low eligibility (less than 5% of the eligible tickets as compared to the proposal they had the greatest number of tickets for) - this is mostly to keep the graphs legible. In the graphs, taller bars mean mostly that the proposal was up for a vote close to the snapshot block, but by looking at the abstain bar you can see what proportion of the mixed ticket pool (at this snapshot) voted which way on proposals before and after that time.
The mixed tickets in this pool snapshot were eligible to make 60,819 votes on Politeia proposals - they used this opportunity on 27,266 occasions, for a turnout rate of 45%.
Whale Stakes
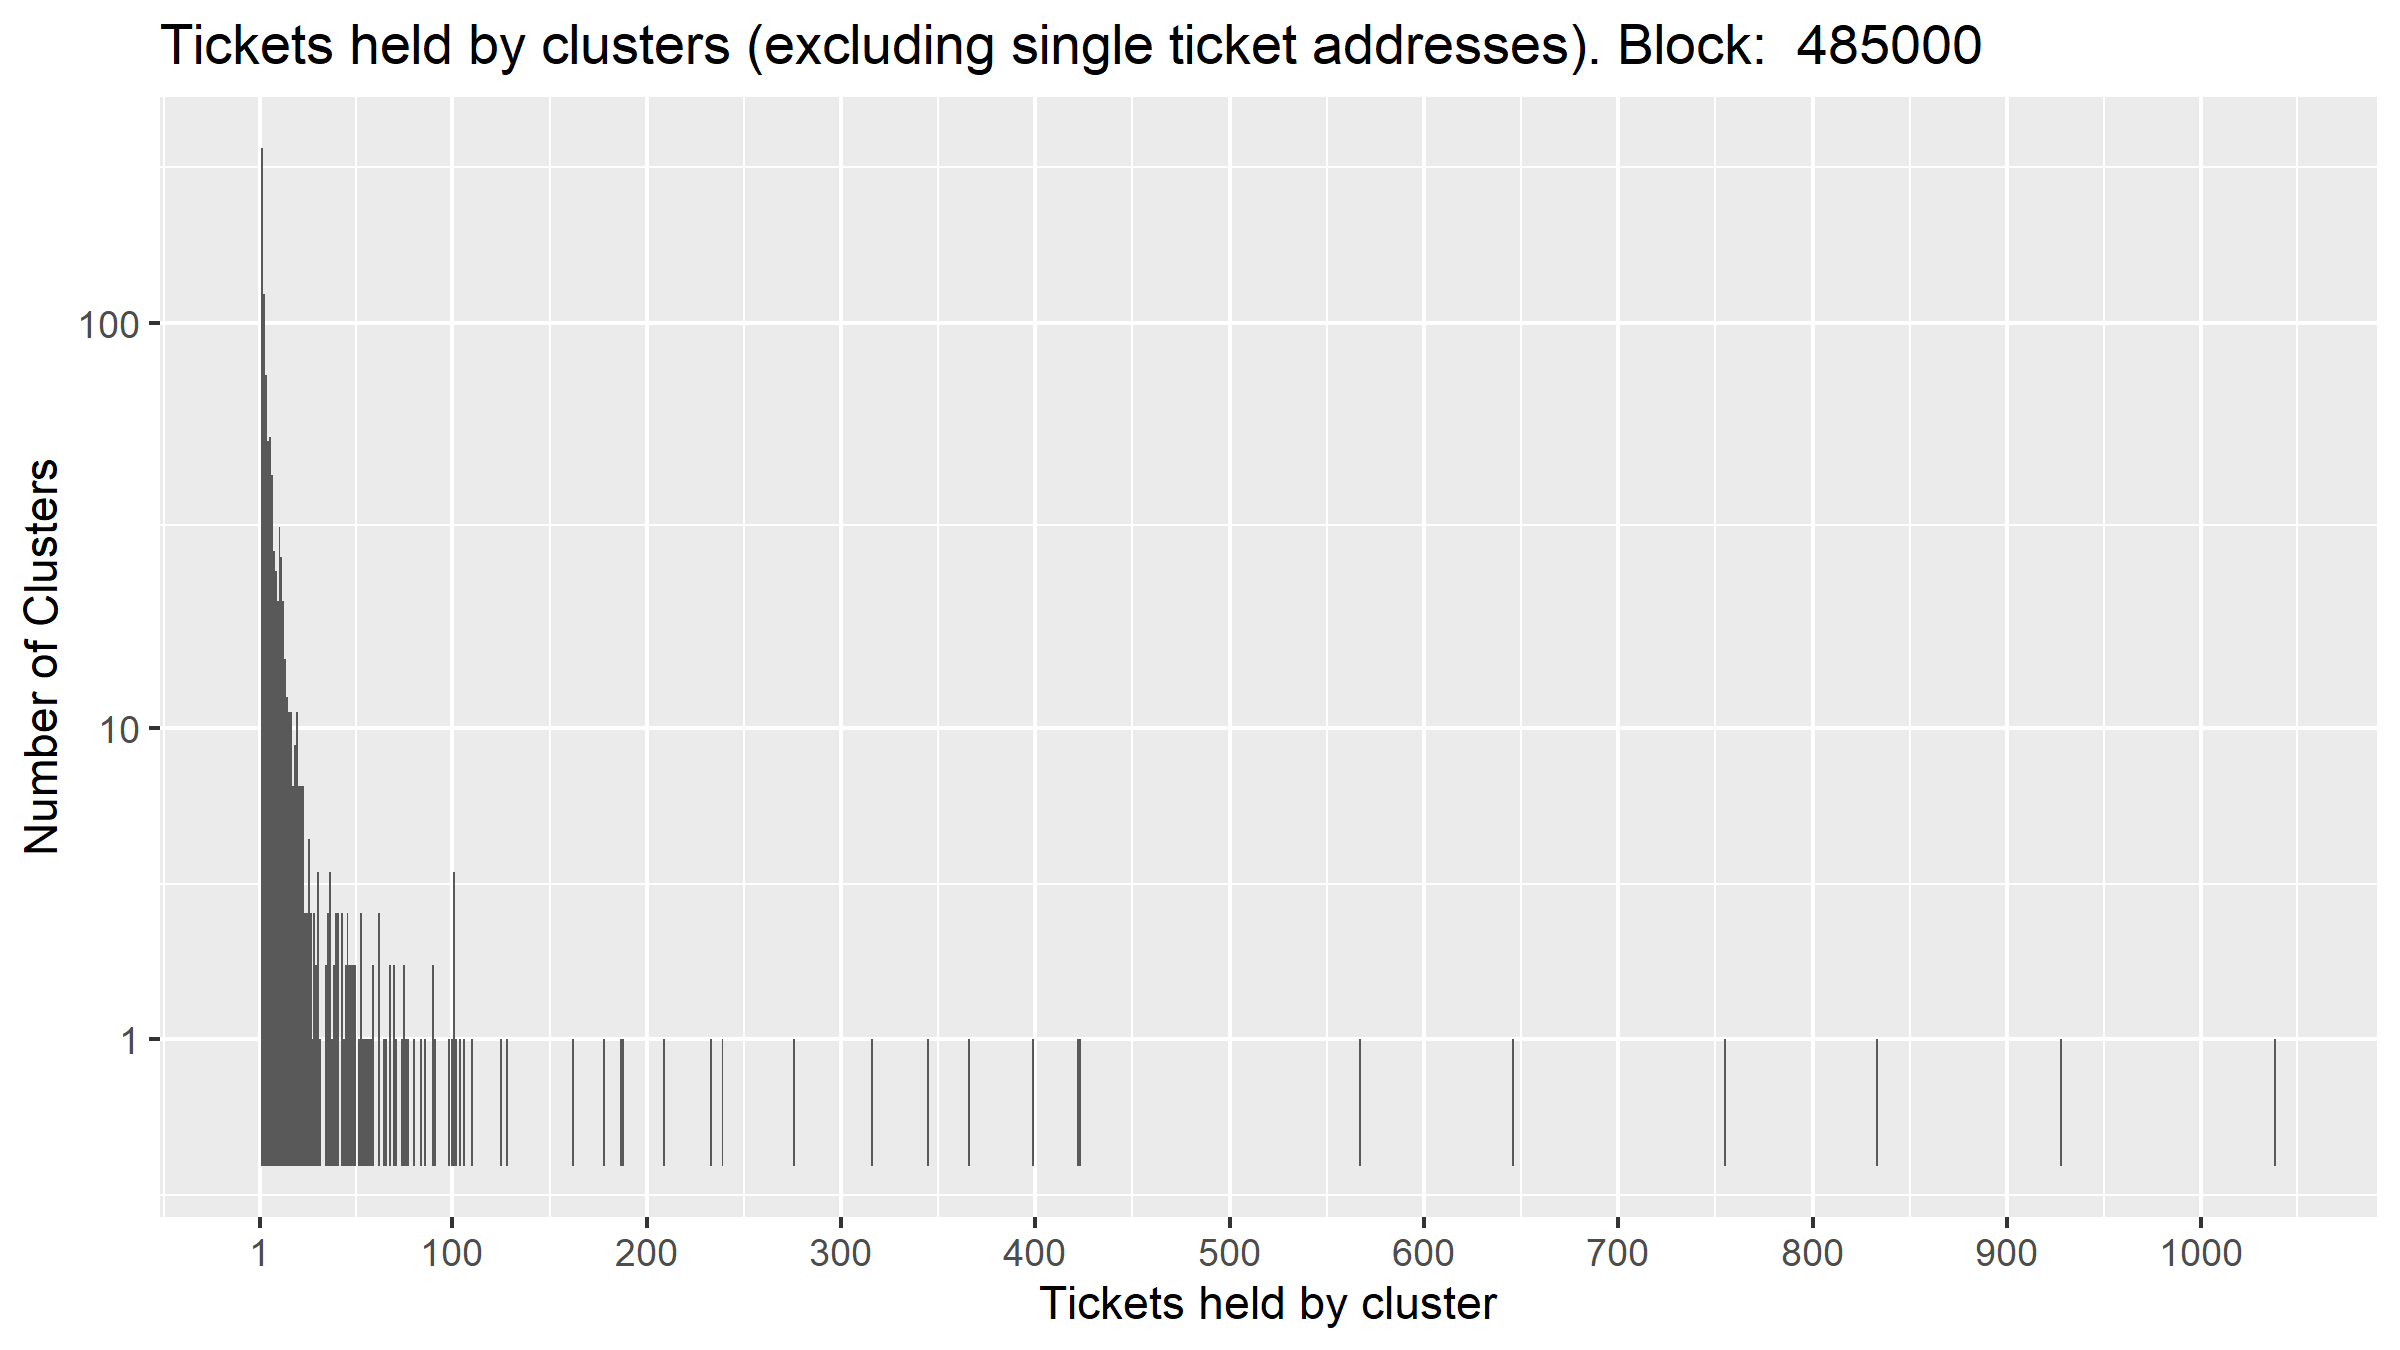
Tickets per Cluster: Block 485,000
This histogram represents each cluster that had at least 2 tickets in the pool at block 485,000 - based on the total number of tickets they had in the pool.
There were 896 distinct clusters with more than 1 ticket each, these are likely to represent individual people, or at least individual wallets.
The short (although I have elongated them to make them visible) bars to the right each represent one cluster. Putting these together, there were 33 users who each held 100 or more tickets, and between them they held 11,255 tickets, which is 27% of the pool.
If we consider the mixed portion (47%) and then these clusters with >=100 tickets that covers ~75% of the pool in good detail.
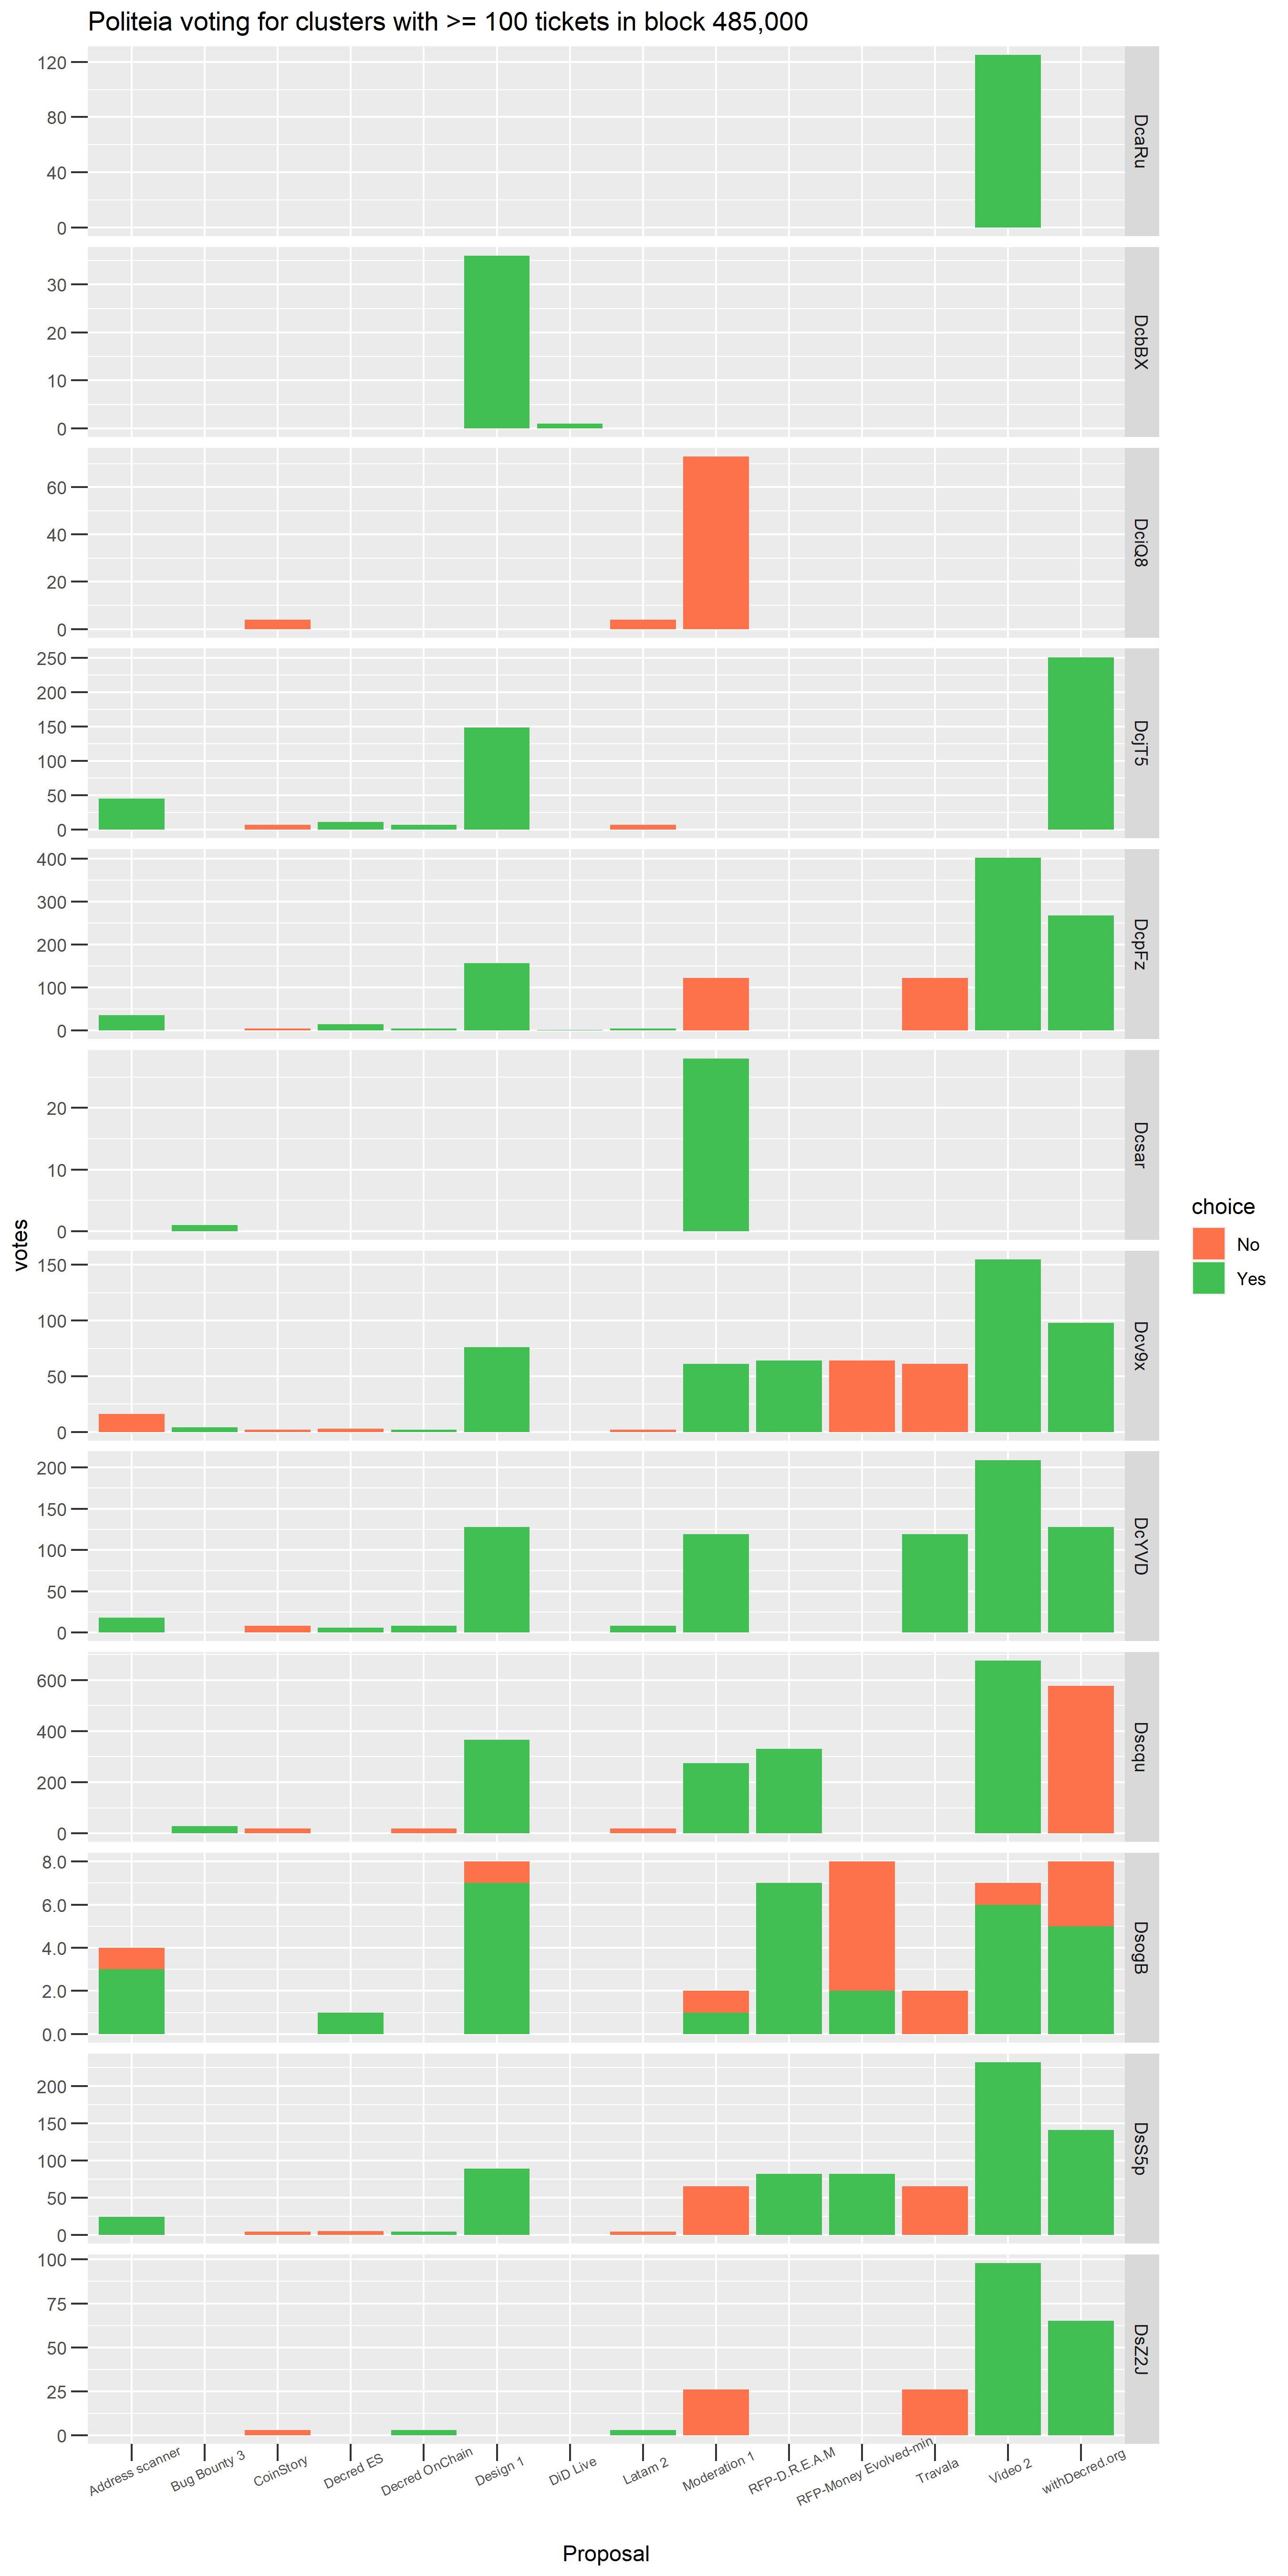
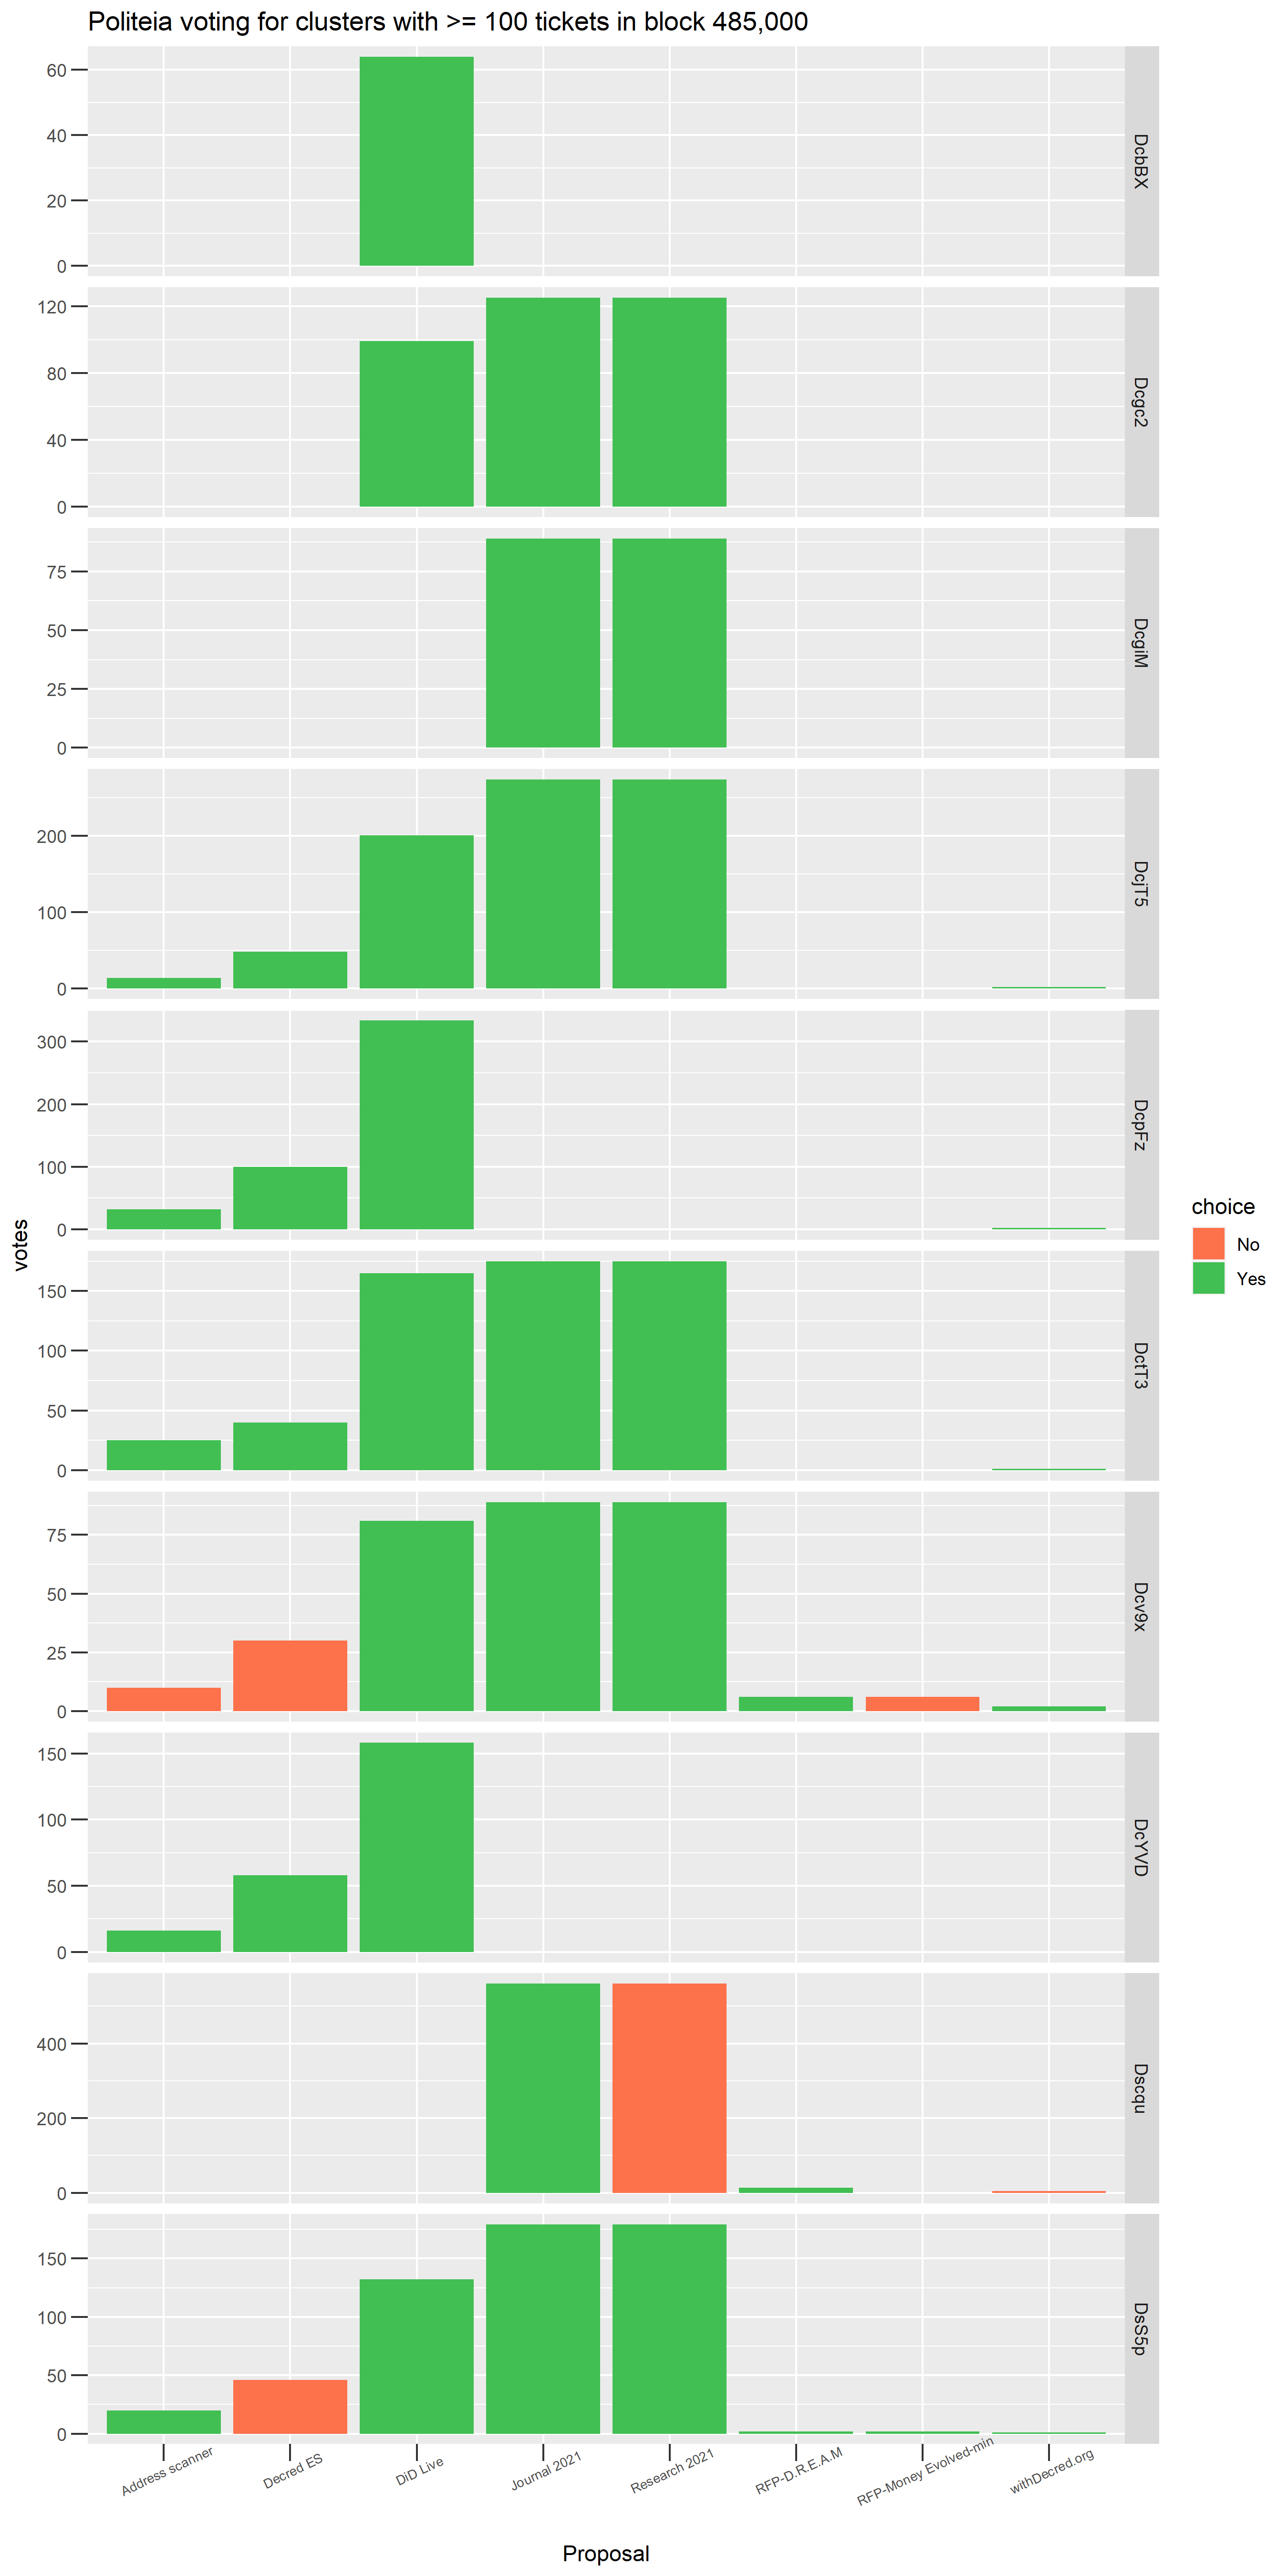
Block 485,000 - Voting by clusters with >= 100 tickets in the pool
It turns out that most of these clusters don’t vote, there are only Politeia votes associated with 12 of the top 33 clusters in this block time period.
I find it interesting to look at these plots of who voted for/against which proposals because it gives a sense of the different ways of thinking about the treasury spending that motivate stakeholder voting. This is something that I plan to pursue with statistical clustering or latent class analysis techniques, as it probably also represents a weakness for StakeShuffle mixing privacy, for stakeholders who vote on many Politeia proposals. Voting a large set of tickets on a large number of proposals would produce a footprint which is easy to follow, even with vote trickling - although some “fuzzing” with contradictory votes could throw this off.
The graph above includes the Dsogb cluster which, as discussed in the deep dive, is an artefact of some clustering issue. After the work refining and testing the clustering (described in the deep dive) the scale of the issue is a small number of tickets - note the scale on the Y axis above, it was around 8 votes per proposal in block 485,000 which look like they came from the dodgy cluster. None of the other clusters exhibit this kind of consistent contradictory voting pattern.
So long stakesubmission address reuse
At the other end of the privacy spectrum from the mixed ticket users are those who re-use the same stakesubmission address for all their tickets. This has been default behavior for various Decred software at different points in time, and my understanding is that the behavior has tended to change as mixing has been deployed within each wallet.
The analysis of stakesubmission address and clusters should produce fairly similar results, although the clustering may connect multiple (re-used) stakesubmission addresses into one cluster. It is however much easier to perform analysis of stakesubmission address reuse directly, as this detail is stored along with every ticket.
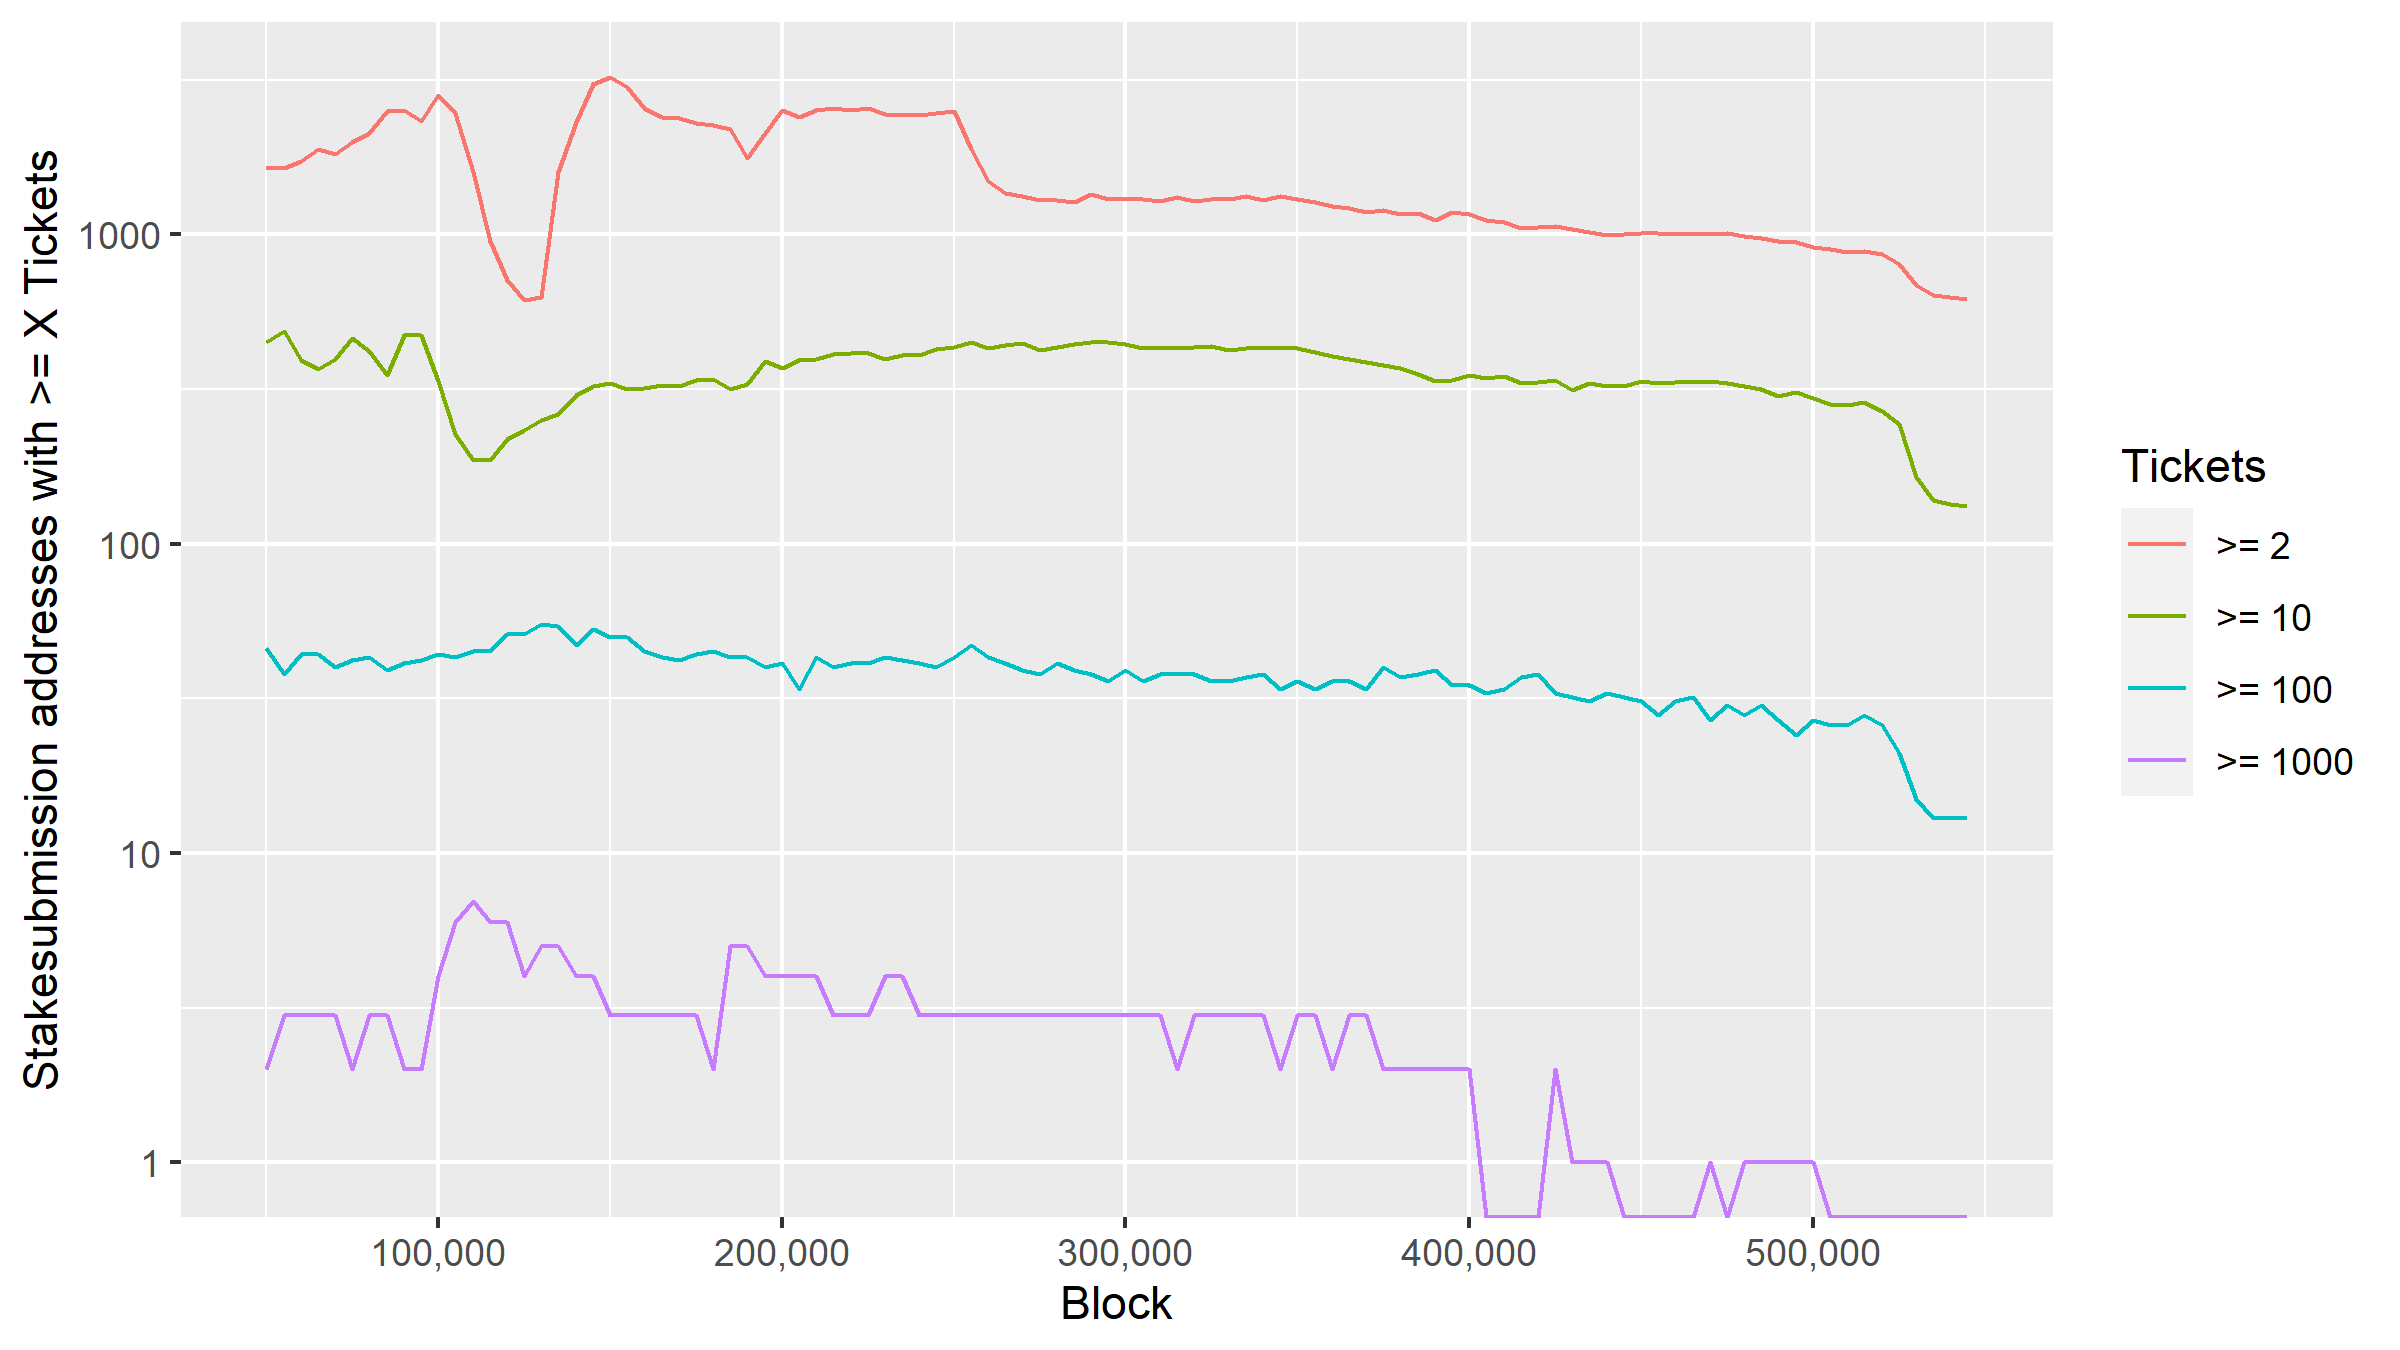
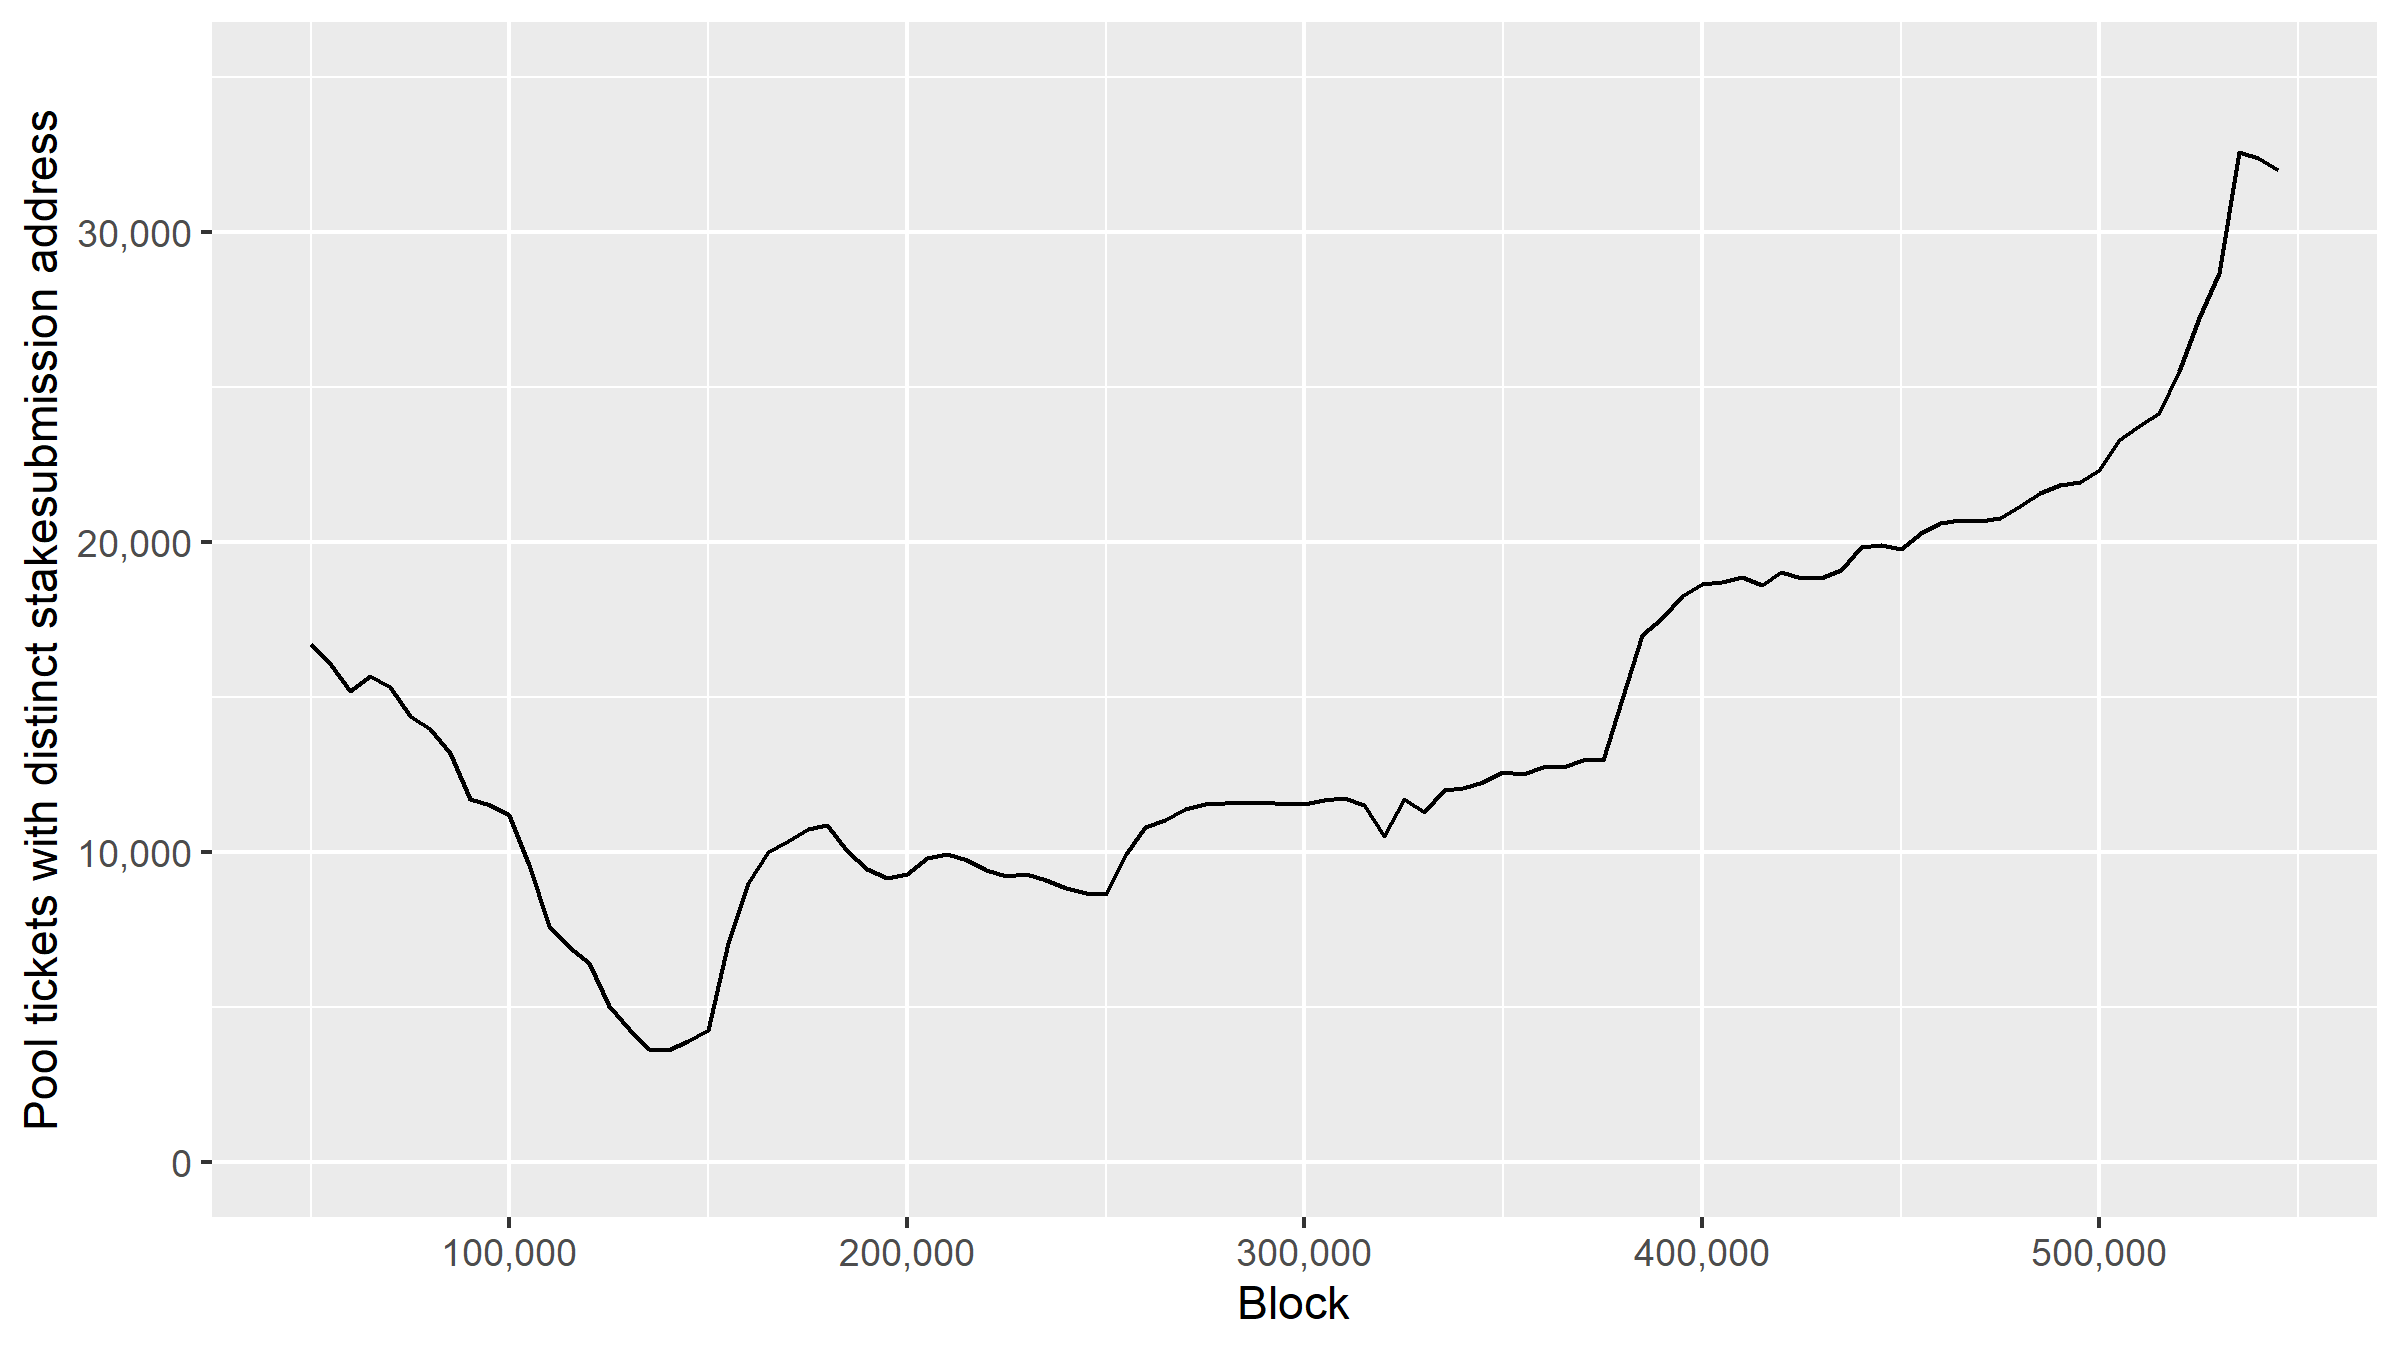
Lines represent the number of stakesubmission addresses which held at least X active tickets
This line graph shows the recent effect of the v1.6 release on Jan 25 (block ~523,000), in which Decrediton does not re-use the same stakesubmission address the same way as its previous versions did. The logarithmic scaling of the Y axis diminishes what is quite a substantial effect, particularly among larger holders. The set of stakesubmission addresses which controlled 100+ active tickets numbered 27 in block 500,000 but fell to 13 by block 545,000.
The converse of this is tickets with a unique stakesubmission address. These can still be linked by looking at inputs to the tickets if they are not mixed, but they at least make the job of anyone wanting to identify a stakeholder’s tickets more difficult - one would probably no longer be able to do it efficiently just by browsing links on a block explorer, it would require a more rigorous computational approach to efficiently group the tickets.
Tickets that did not share a stakesubmission address with another ticket in the pool
139 Decred Voting Days
Jumping forward 40,000 blocks to block 525,000, let’s repeat the same observations of the ticket pool to see what has changed and what has stayed the same.
A quick question we can answer is whether the clusters we saw in block 485,000 are still staking in block 525,000.
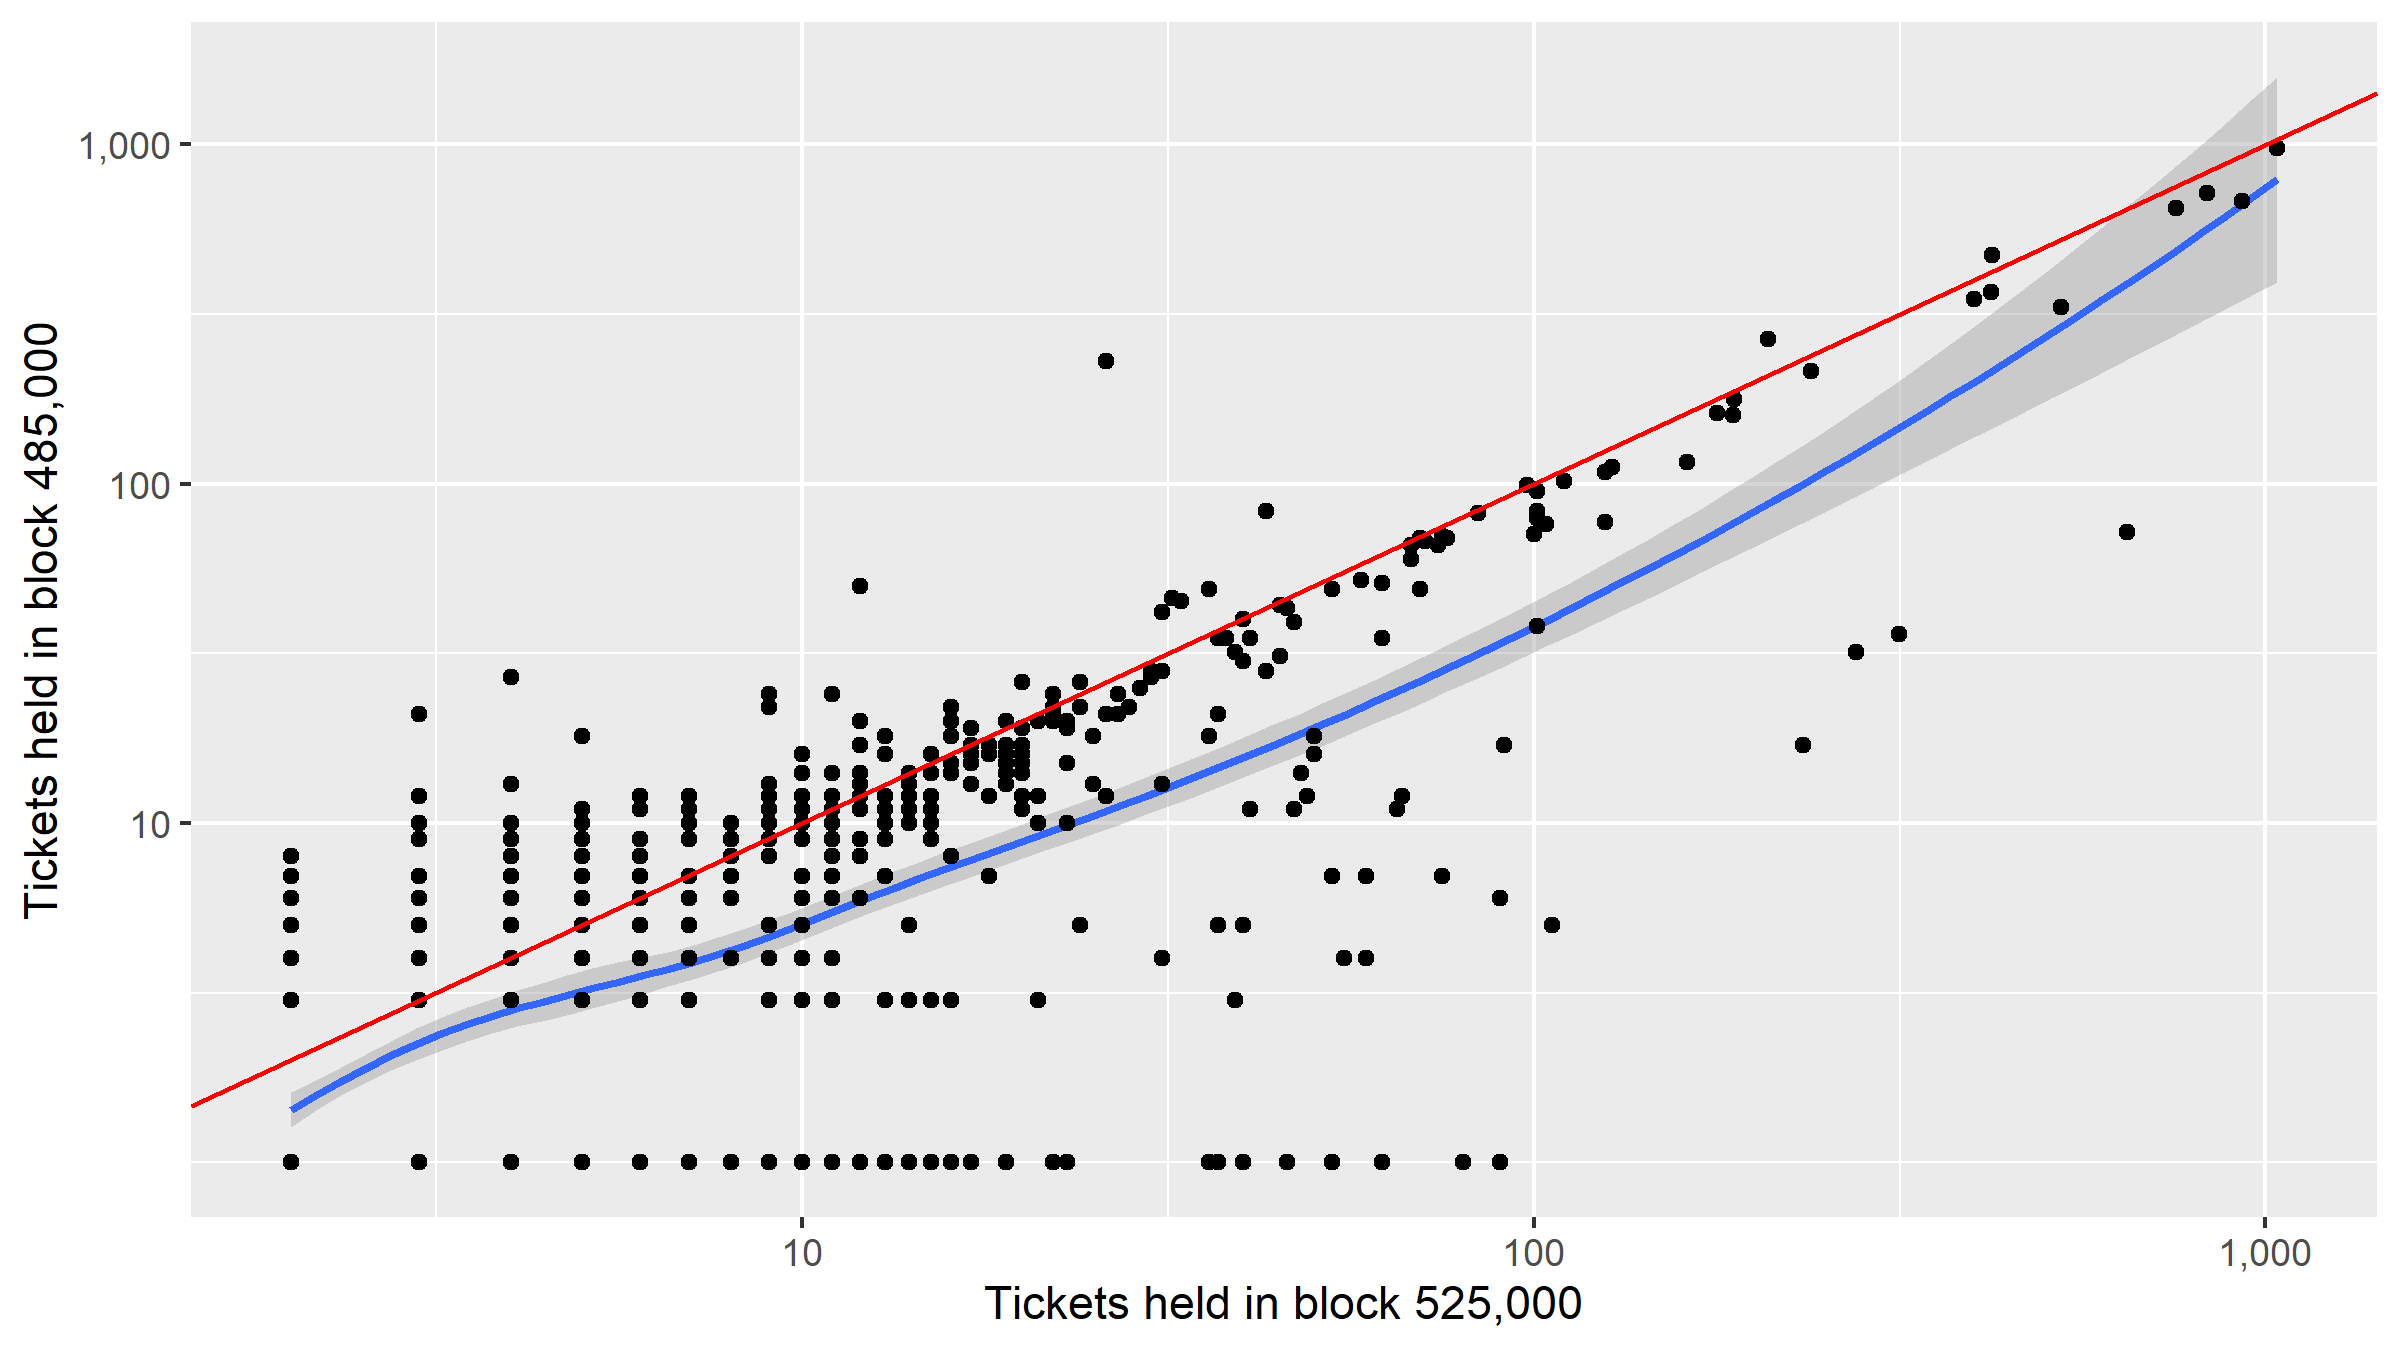
Scatterplot showing the number of live tickets held by a cluster in block 485,000 and block 525,000.
I added a +1 transformation to the block 525,000 ticket count, otherwise the zero counts (where the stakeholder dropped out) would have been omitted from the graph with logarithmically scaled axes.
The blue line in the graph is a line of best fit, the red line is where clusters that had the same number of tickets in block 485,000 and 525,000 lie, points above the red line reduced their number of tickets between block 455,000 and 525,000.
There is a strong positive correlation (r = 0.92) between the number of tickets held at block 485,000 and at block 525,000. This suggests that the non-mixing stakeholder population was quite stable during the time period under consideration.
Surveying Block 525,000
At block 525,000, I count 26,933 distinct entities - this is about ~4,000 more than block 485,000, and again most (26,237) of these entities are only associated with one ticket each. There are 24,047 mixed tickets in the pool, so the proportion has gone up (to 58%, from 47% previously).
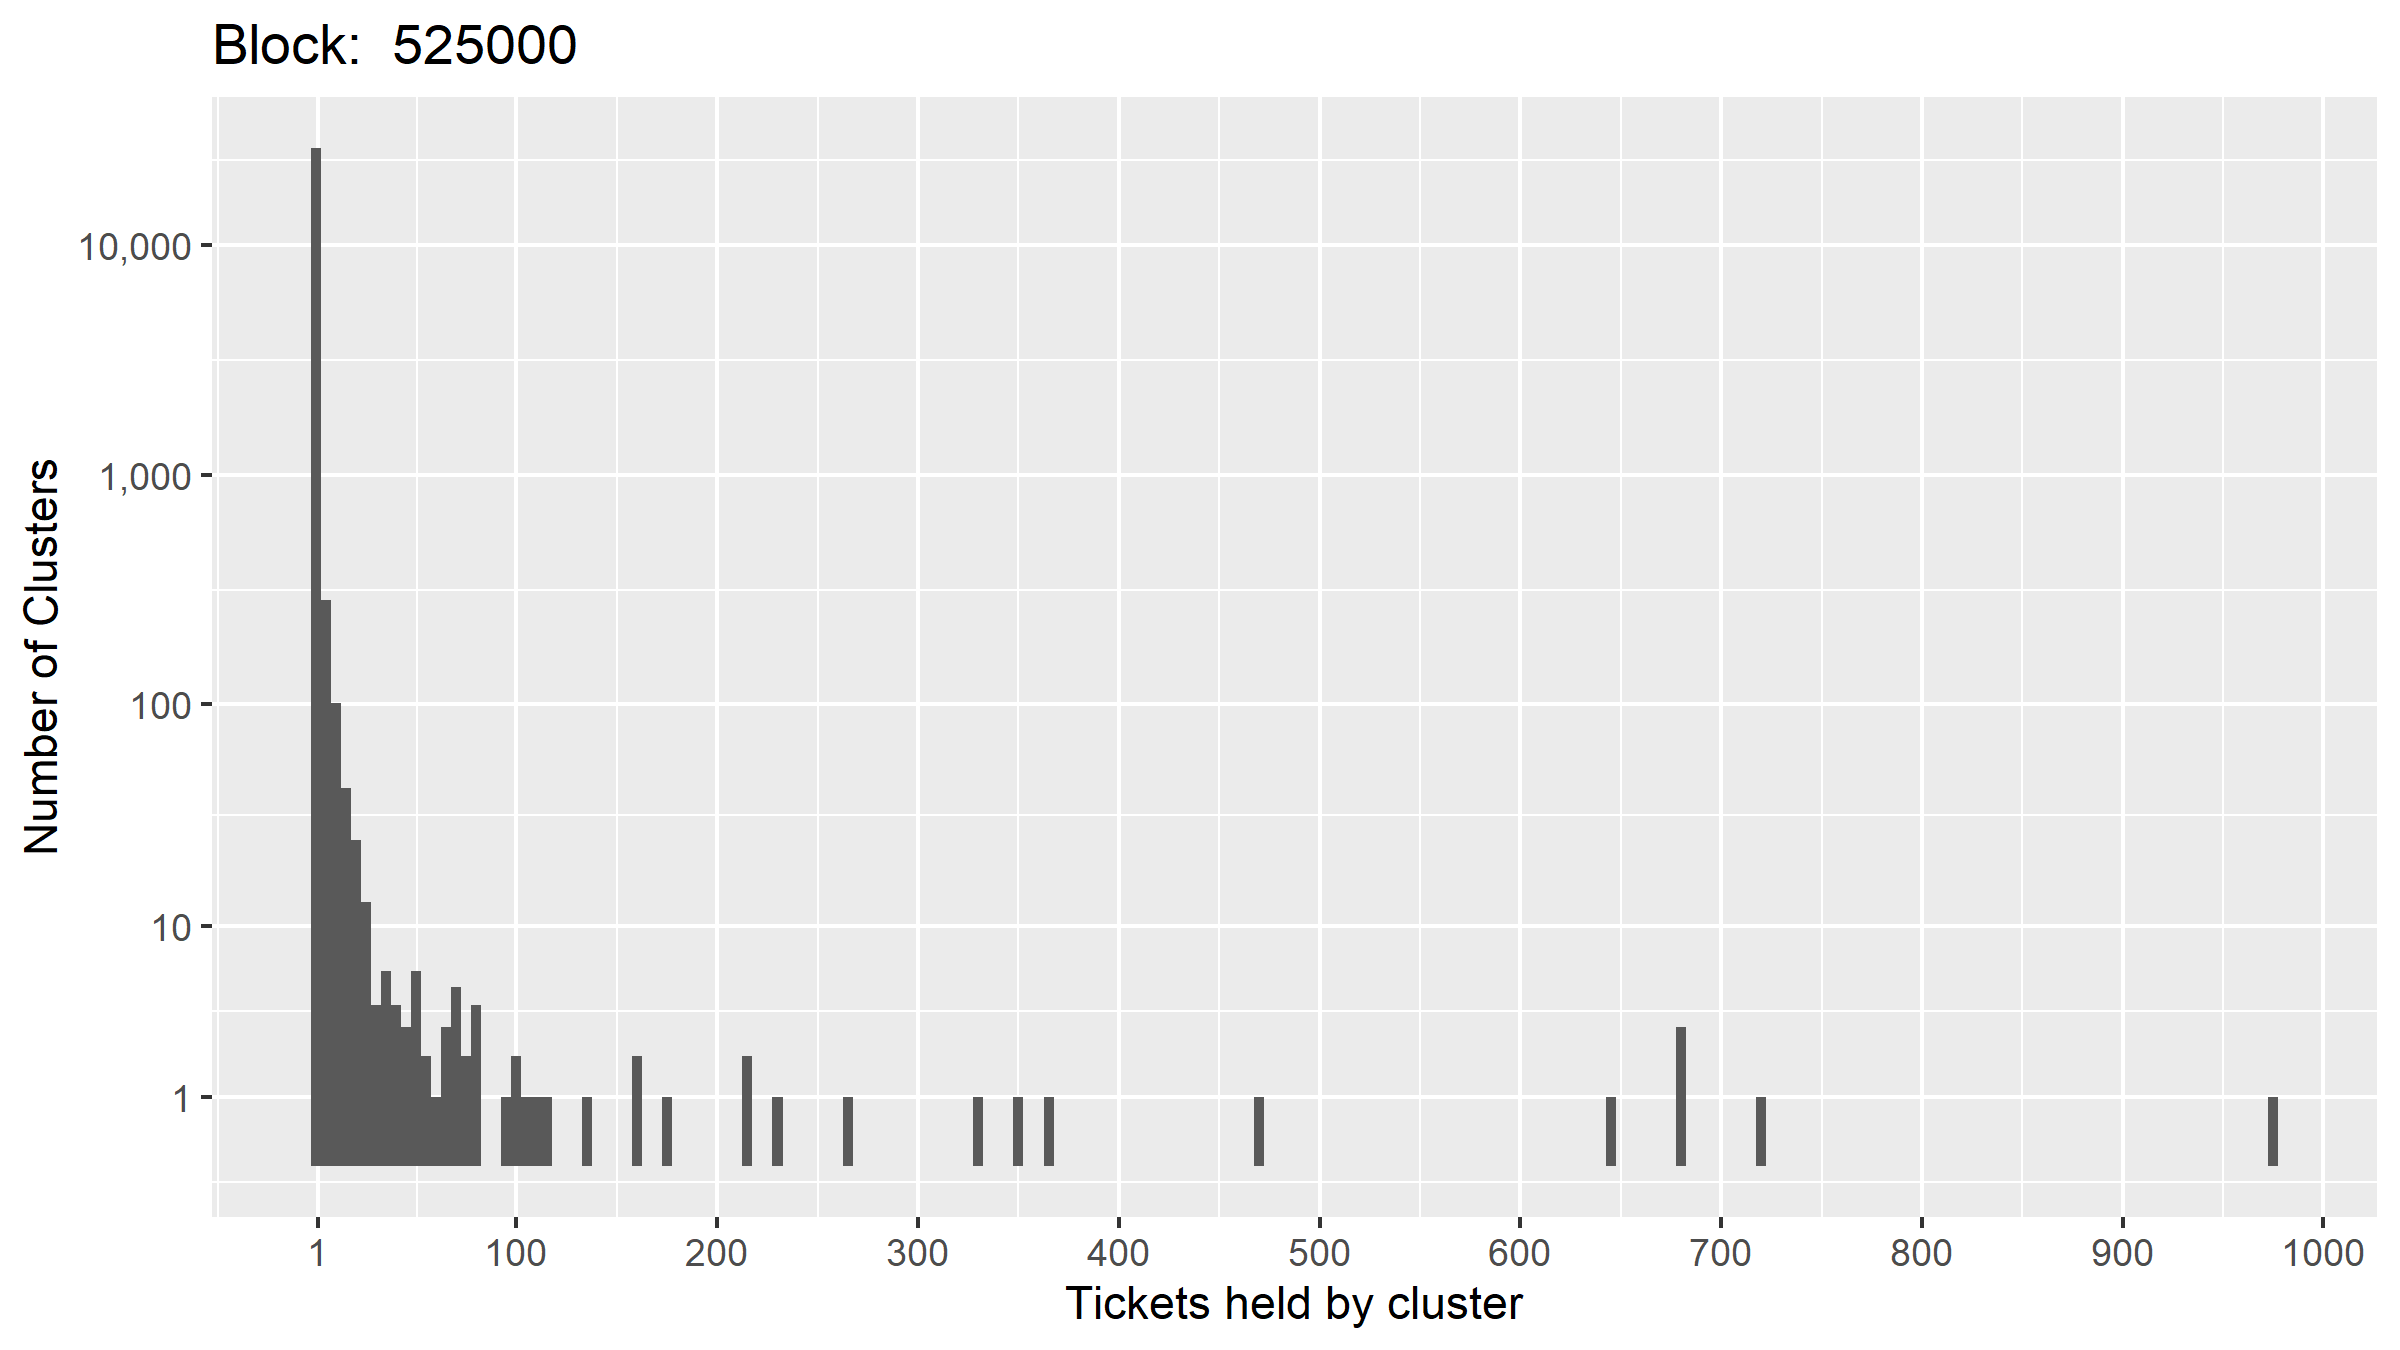
Bar chart showing distribution of tickets between clusters - Block 525,000
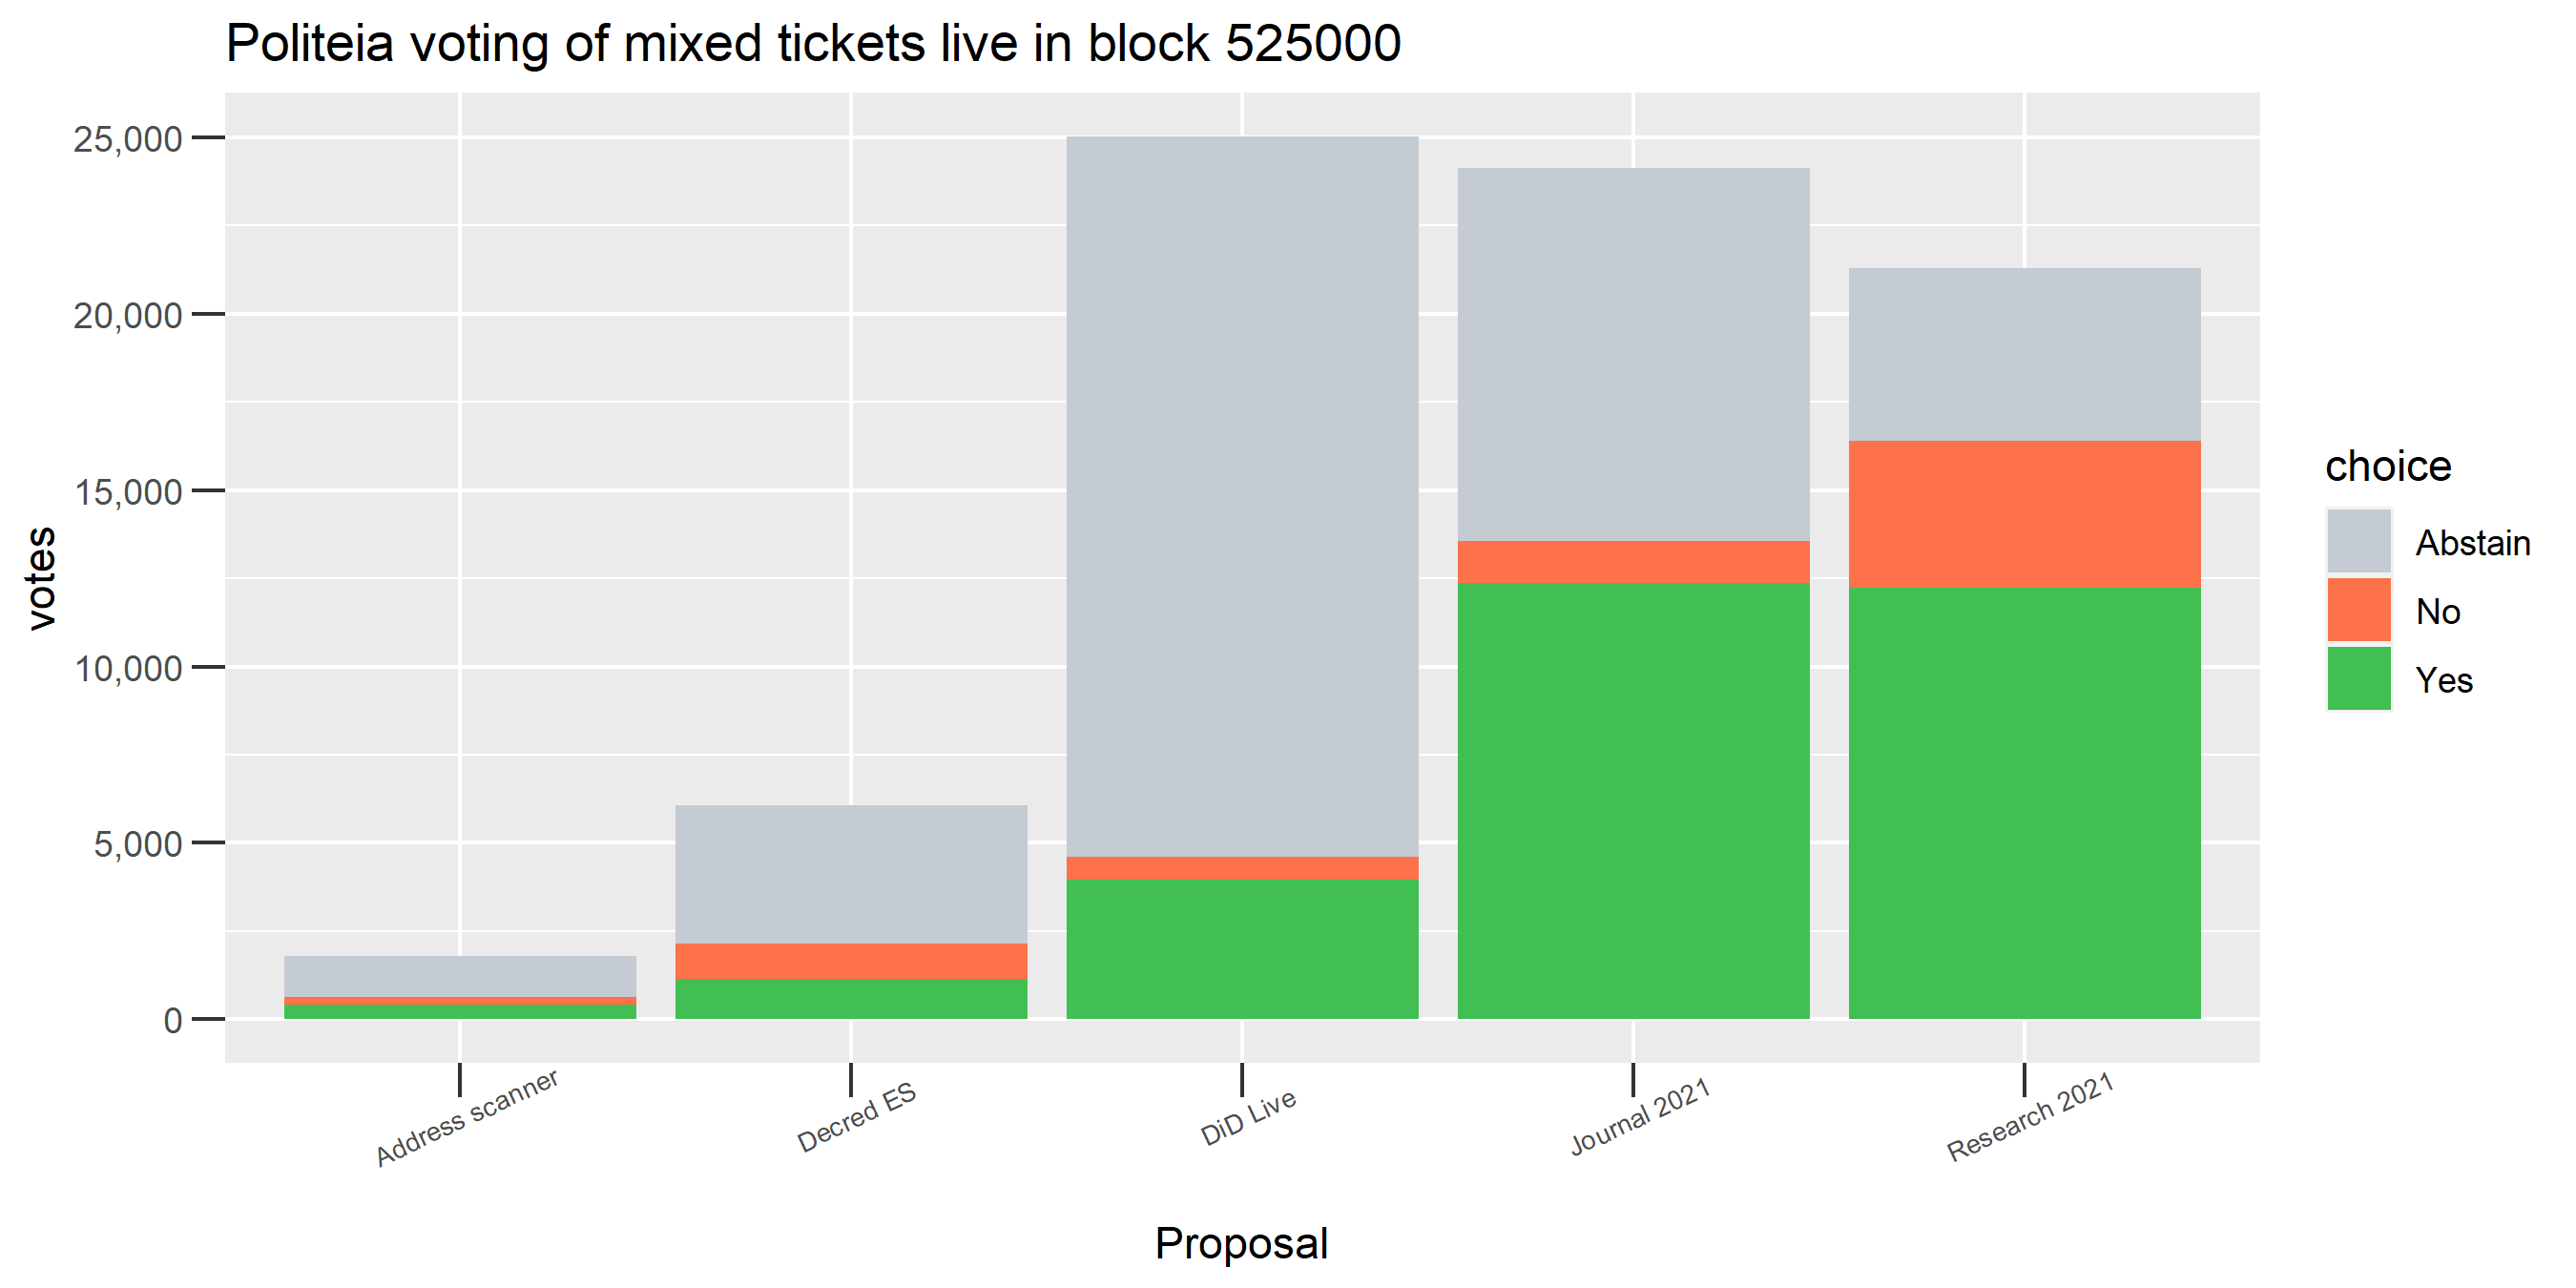
Block 525,000 Mixed Tickets Politeia Voting
The participation rate for mixed tickets in this block worked out to be 36%, again the voting looks to follow a similar pattern to the unmixed ticket voting.
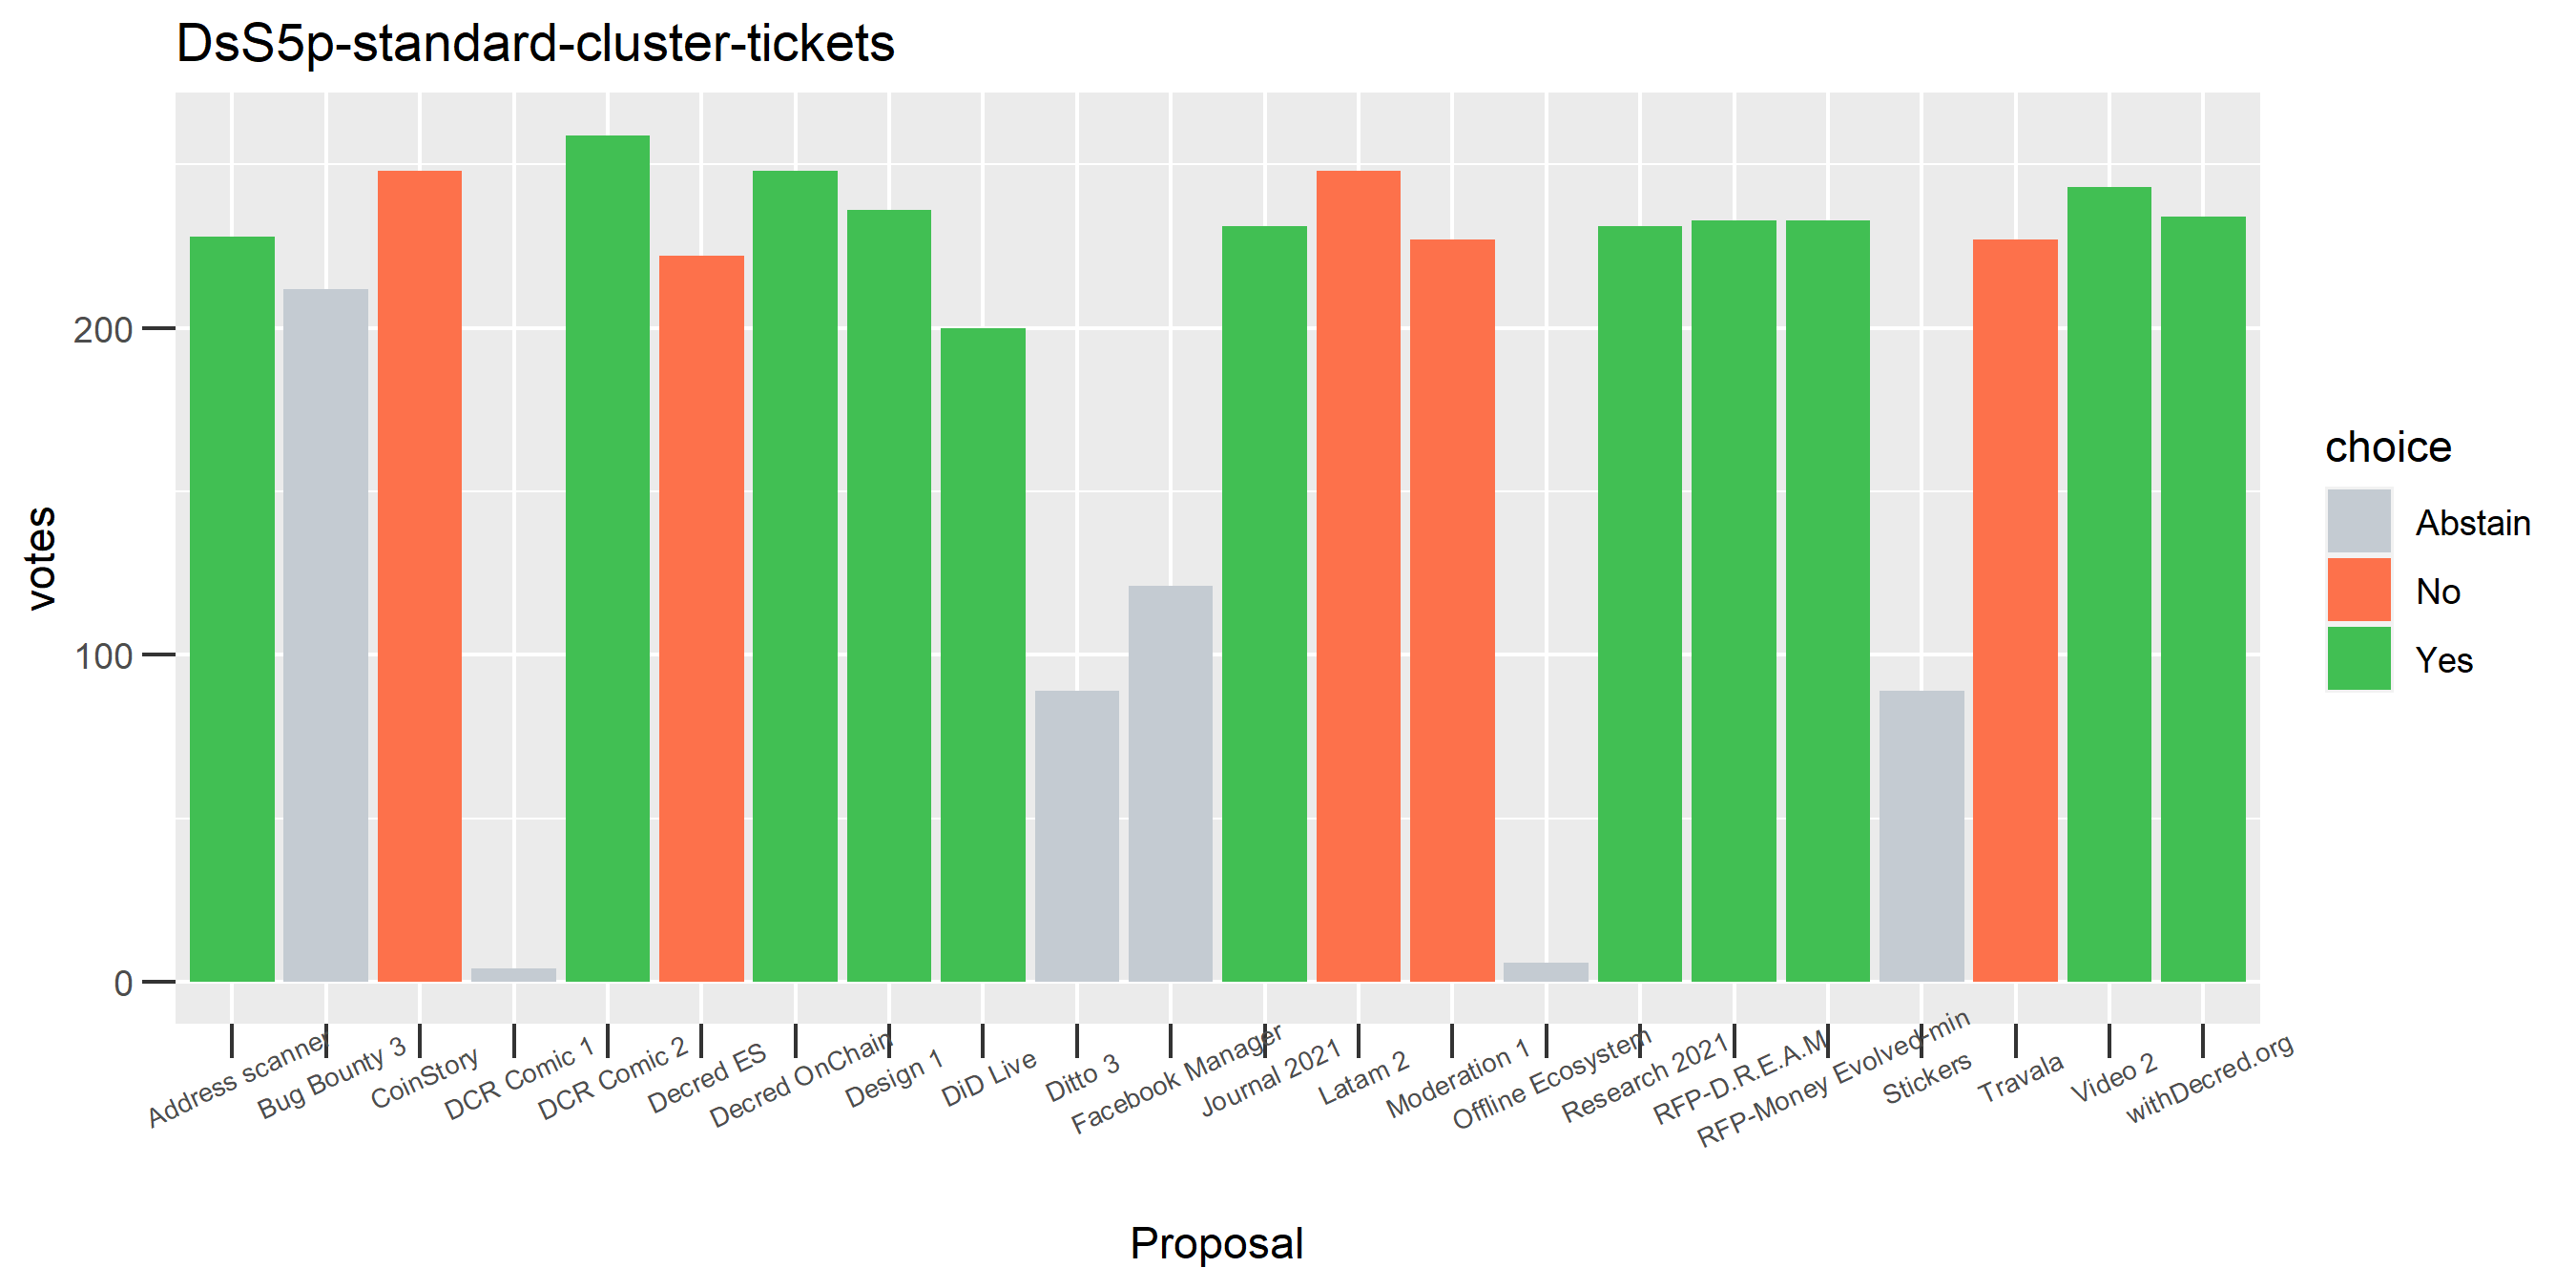
Block 525,000 - Voting by clusters with >= 100 tickets in the pool
There are fewer clusters now with 100 tickets or more, down to 22 clusters meeting the criteria and just 10 of these had any Pi votes.
The graph showing voting per cluster doesn’t include abstained tickets. For this block most of the proposal voting is positive, but this is just because there were more successful proposals around block 525,000.
Historical look at the clusters
I ran my cluster analysis on all of the clusters/addresses which had more than 1 ticket in these blocks, to see what this historical data can add to the interpretation of the ticket pool activity.
A good starting point is to consider whether these entities are stable or dynamic in their behavior - if the cluster has many tickets in block 525,000 does that mean it tended to hold many tickets historically?
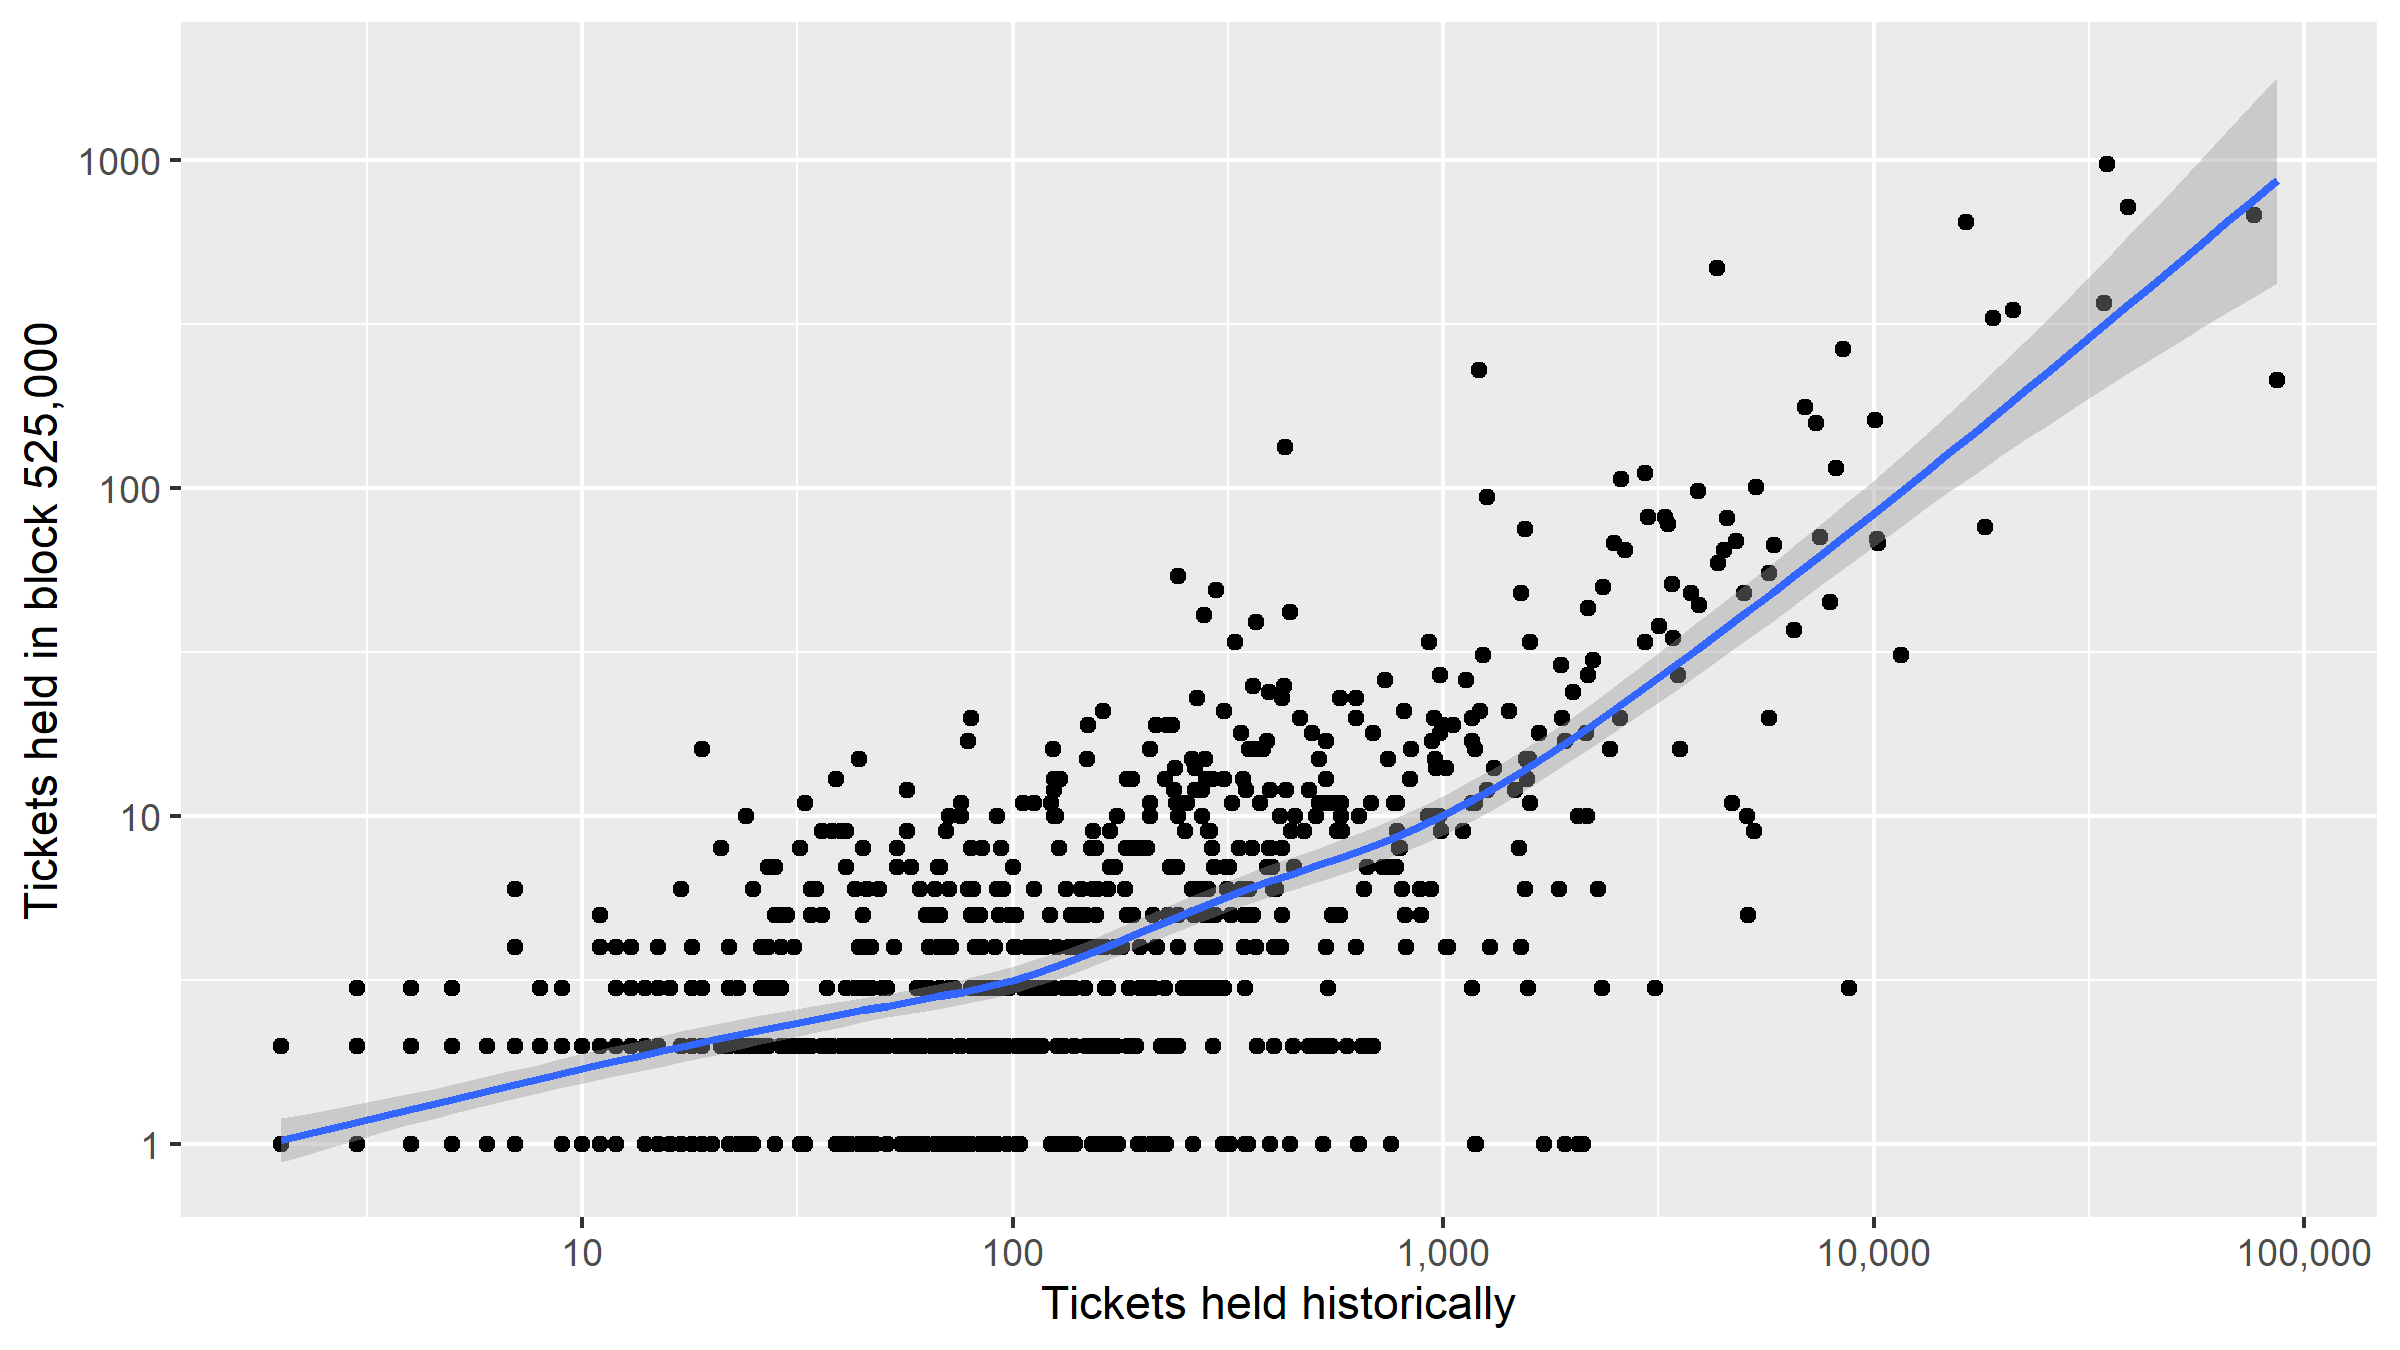
Scatterplot with logarithmic axes, block 525,000 Tickets held vs historical tickets held per cluster
The correlation between live tickets and historical tickets is 0.71, so quite strong. Most of the clusters with many tickets in this block tended to have many tickets historically.
We can also look at how long these clusters have been active, in terms of all of the activity associated with the addresses which have been grouped together.
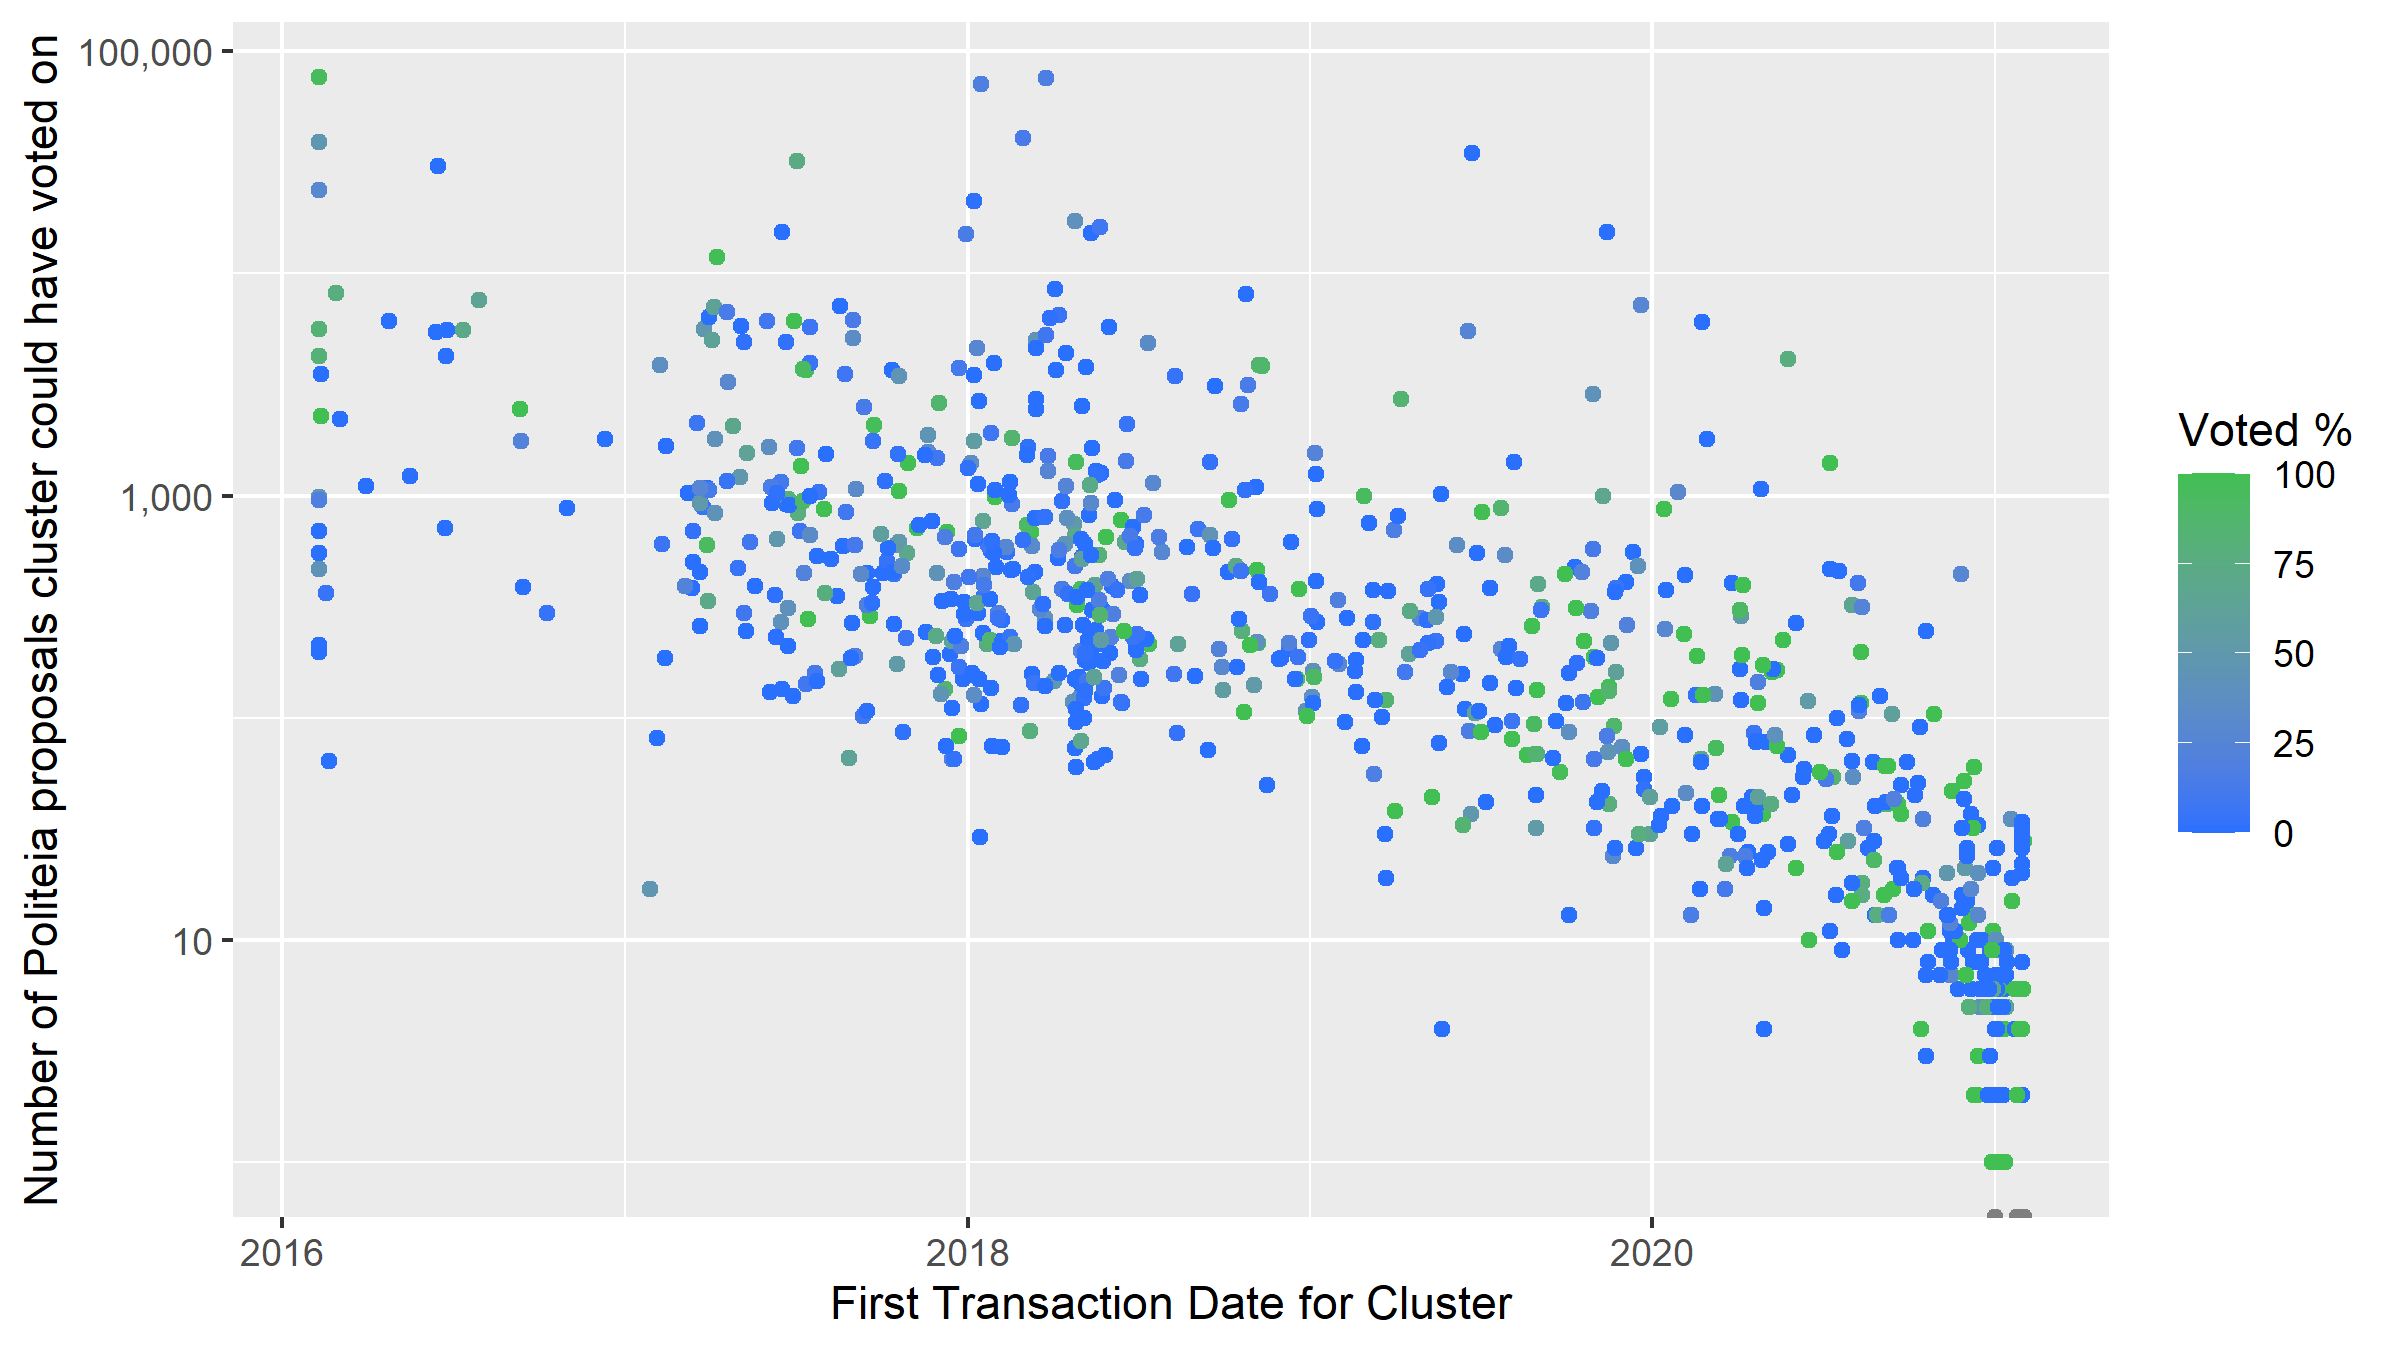
Scatterplot showing age of cluster (x axis), number of possible Politeia votes (y axis) and Politeia voting participation rate (color)
This graph is quite interesting because it suggests that there is a relationship between when clusters became active and how often they vote on Politeia proposals. There was a time around early 2018 when many of these clusters first became active, and most of the clusters originating around that time have very low participation in Politeia votes. Politeia didn’t start hosting proposals and votes until October 2018, so it’s unlikely to be due to anything that was happening with the proposals specifically.
The more recently activated stakeholder clusters show a higher vote participation percentage. 2018 stands out as a time when large stakeholders joined which would not actively vote with their tickets once Politeia launched.
Categorising voters
While it is easy enough to compile a record of the DCR and ticket movements associated with unmixed clusters, it is much harder to distinguish between different “types” of user looking only at this information. One of the easiest ways to bring in additional information is to look at where the user’s DCR came from. DCR that was mined, that came from the Treasury, and that came from the genesis block (Airdrop and Founders’ reward) is easy to find on chain - which means clusters that received it can be tagged. For this analysis I have merged the data for 1 or 2 hops from source to give a simplified view of whether a cluster is associated with a particular source of DCR. Some of the clusters appear in a few different types, complicating the question of how to construct these.
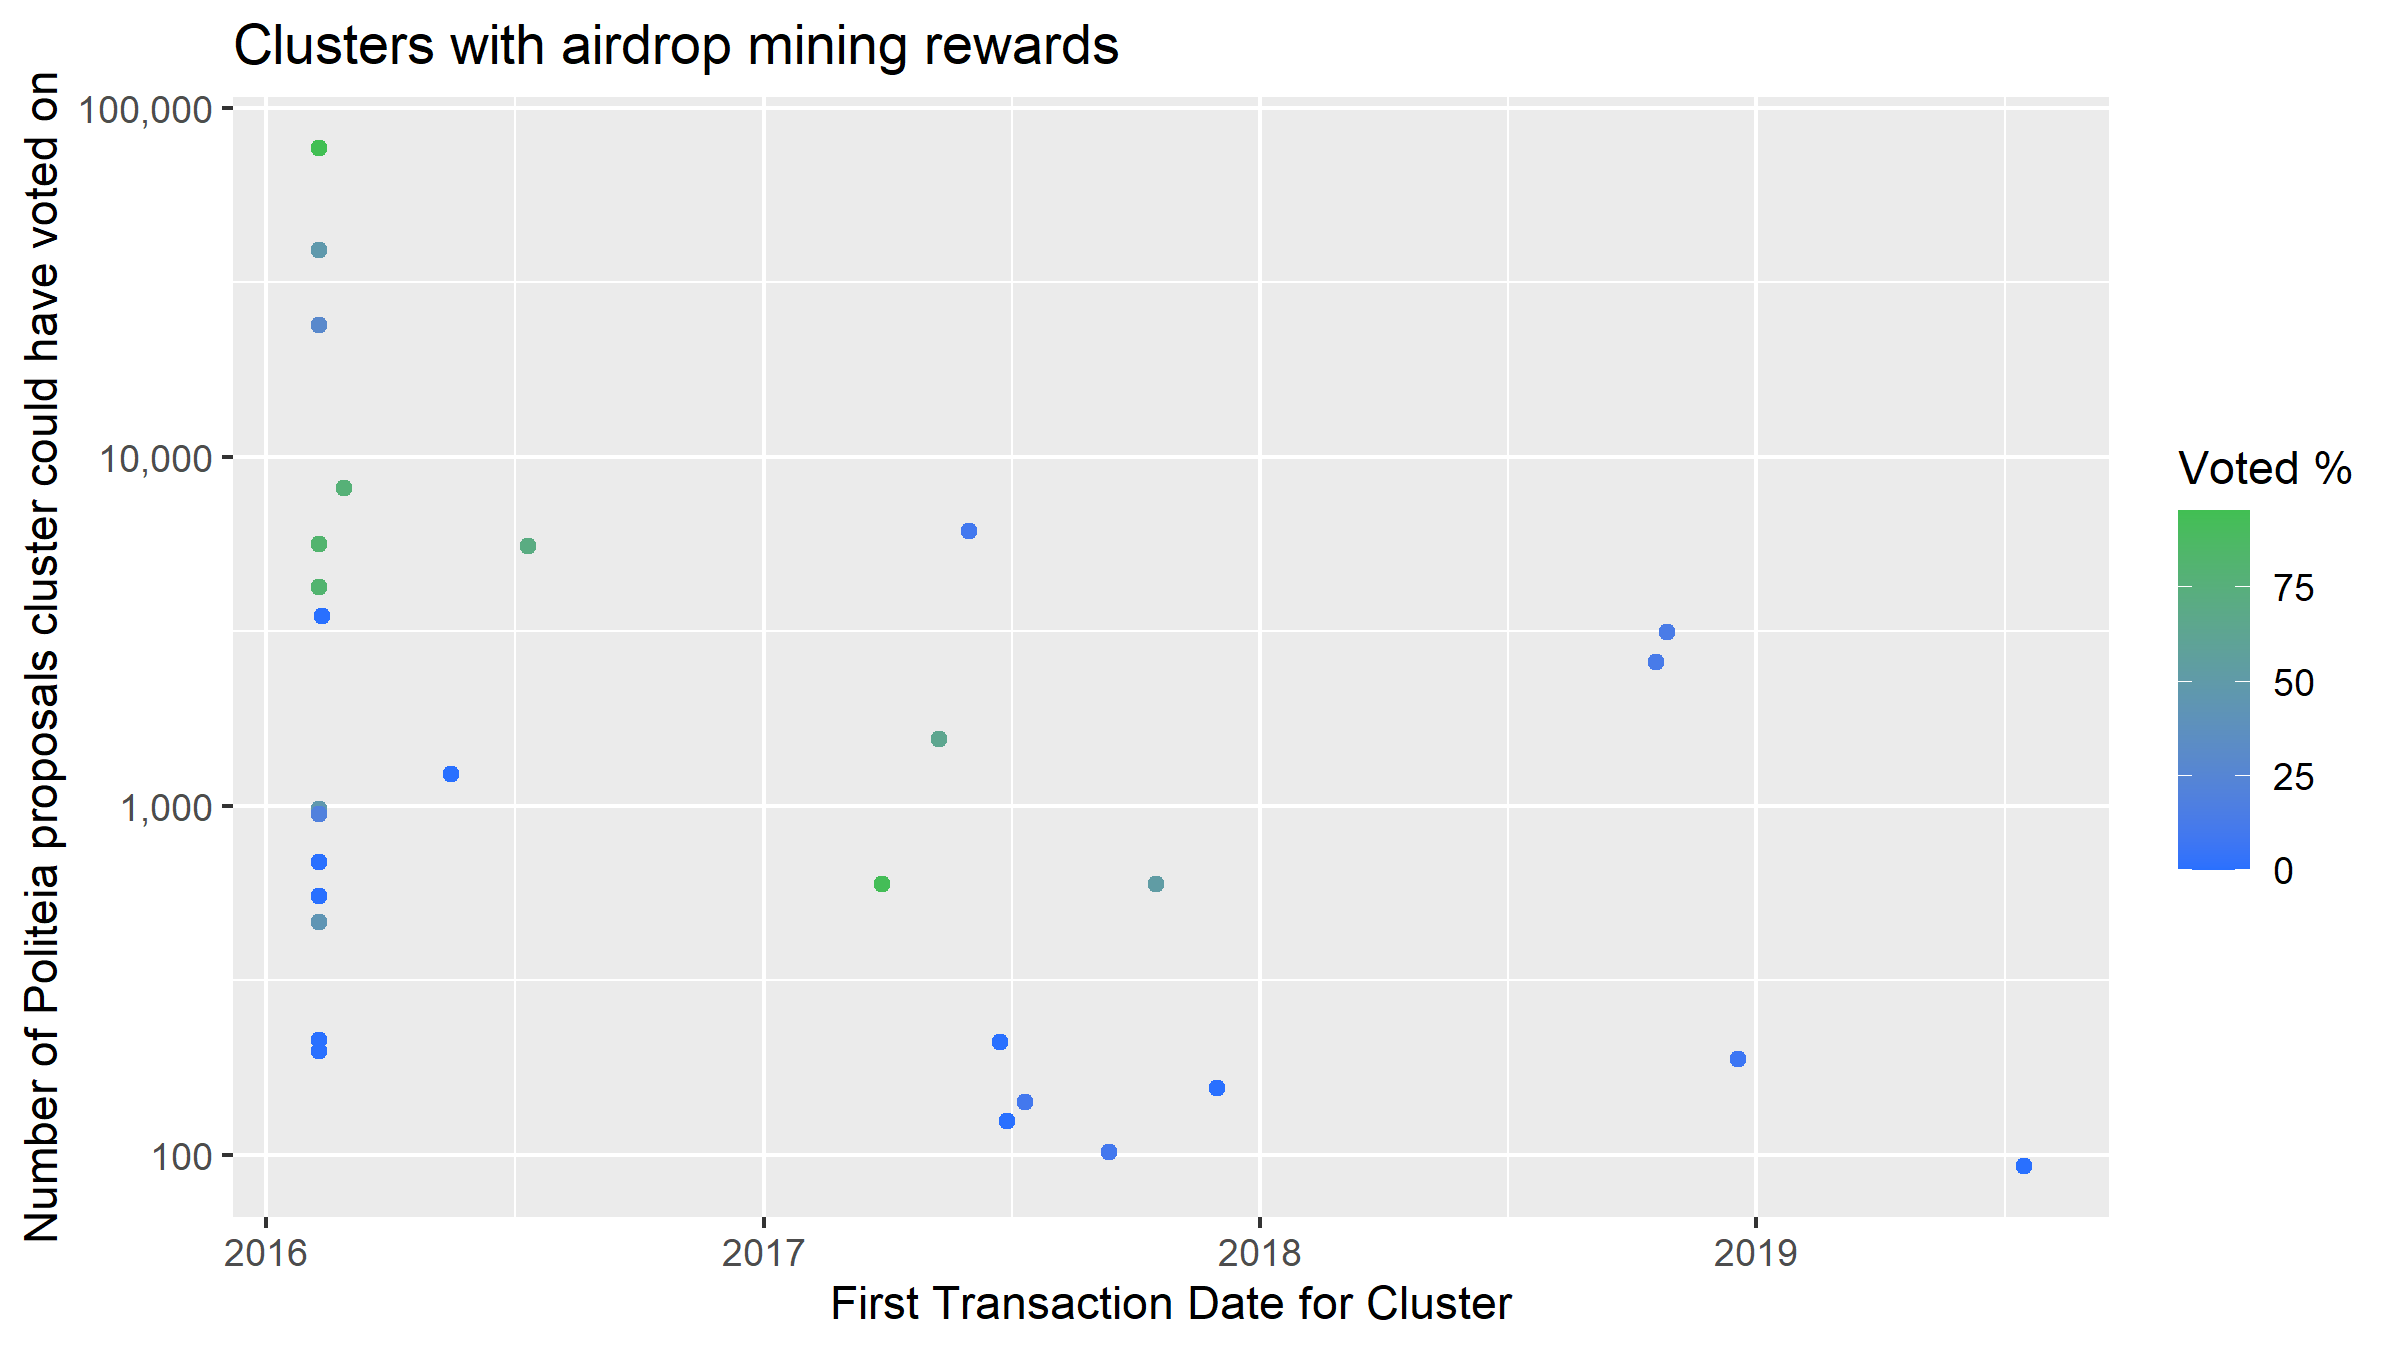
Scatterplot for clusters with incoming airdrop rewards showing age of cluster (x axis), number of possible Politeia votes (y axis) and Politeia voting participation rate (color)
It is not surprising to see that a number of airdrop recipients have been active since 2016 and were still staking in block 525,000 -among them some large and highly responsive Politeia voters. The graph also suggests that a number of people “activated” their airdrop in mid-2017 and became stakeholders (to block 525,000), and there are even some airdrops activating in late 2018 to join the ticket pool.
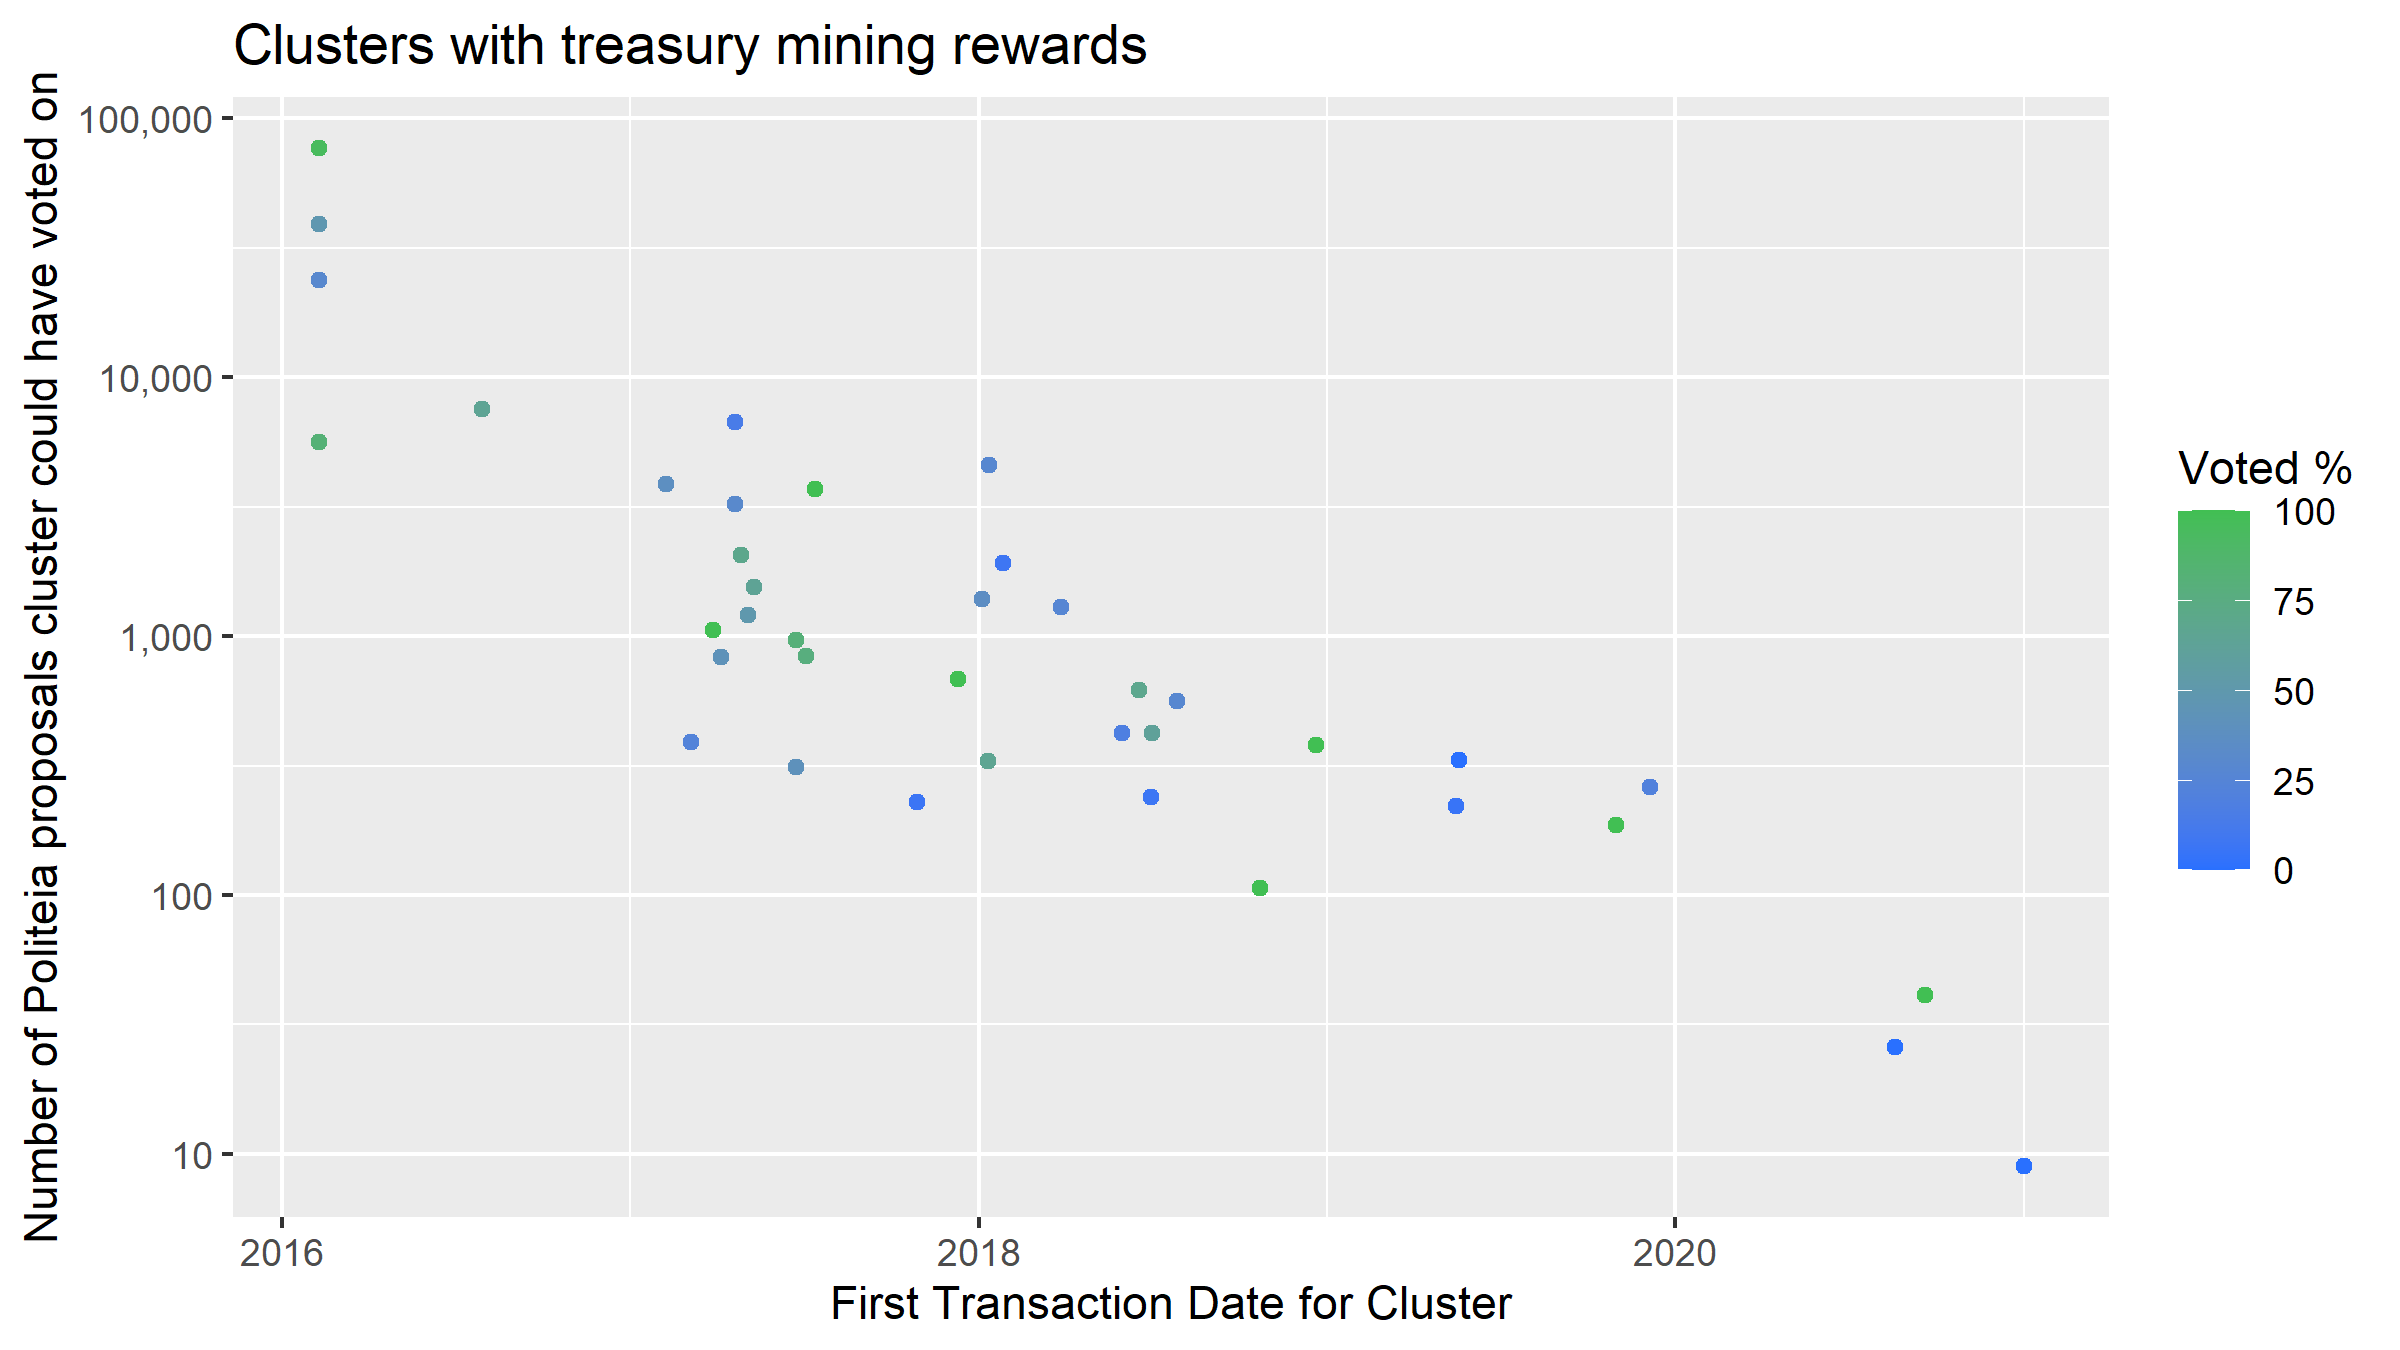
Scatterplot for clusters with incoming Treasury rewards showing age of cluster (x axis), number of possible Politeia votes (y axis) and Politeia voting participation rate (color)
Looks like many of the contractors who stake their DCR (to block 525,000) have quite high participation rates in Politeia voting.
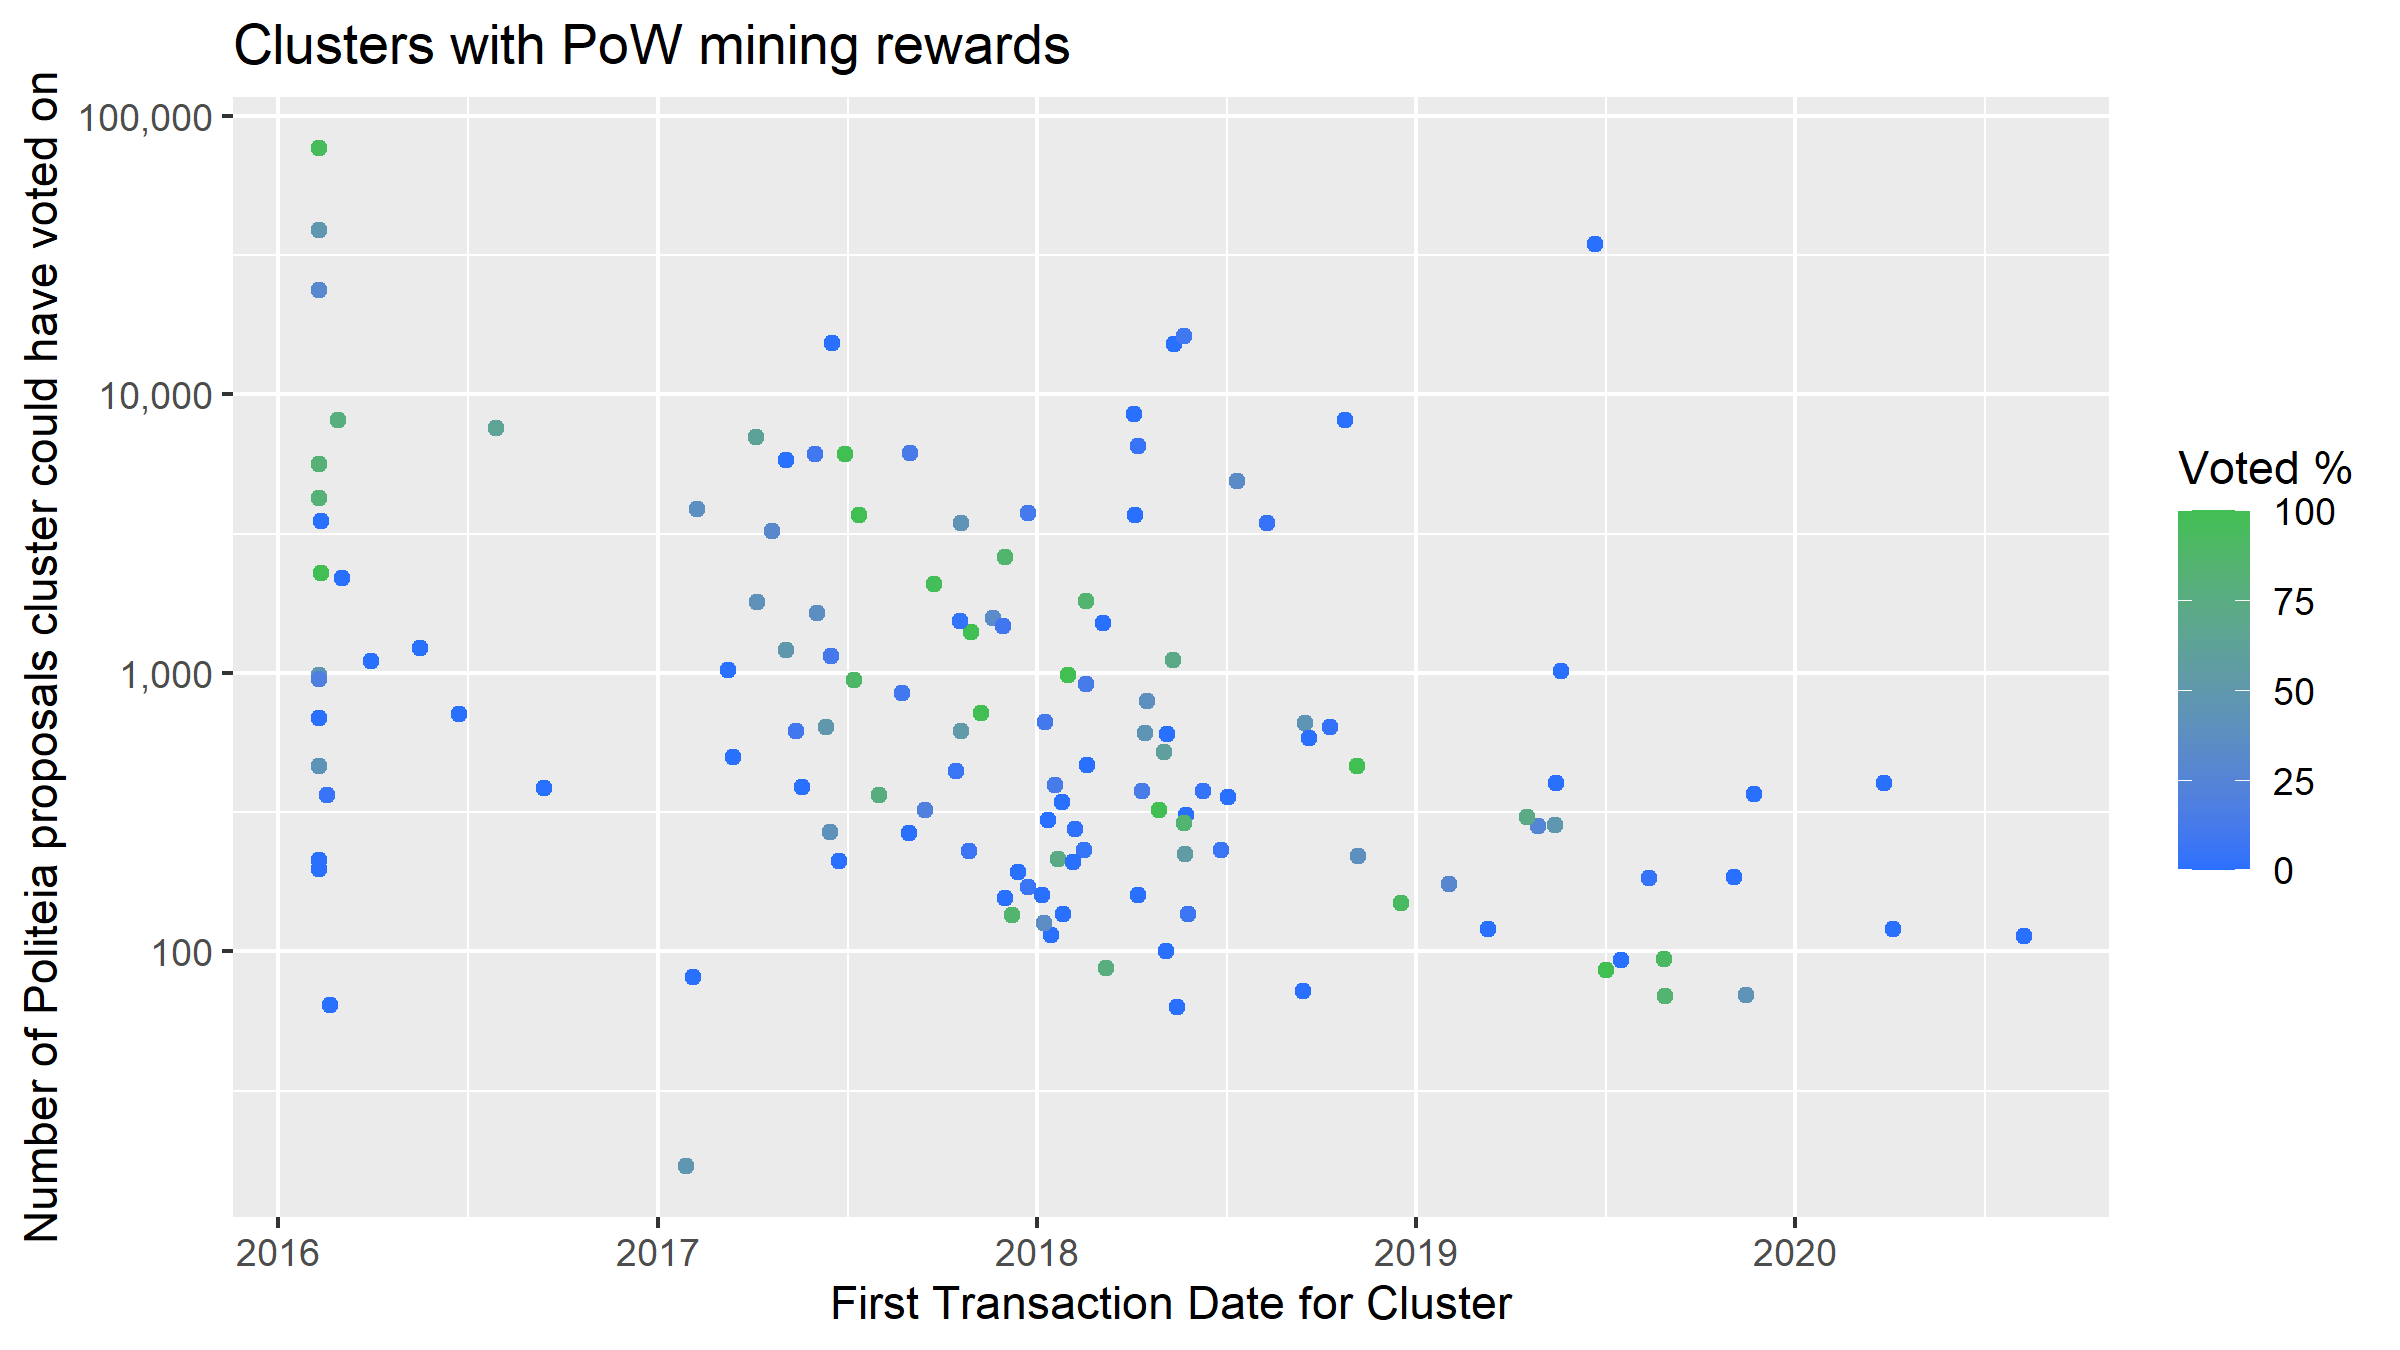
Scatterplot for clusters with incoming PoW mining rewards showing age of cluster (x axis), number of possible Politeia votes (y axis) and Politeia voting participation rate (color)
This one suggests that there are many stakeholders who have been active since 2016, mined DCR (probably early) and then kept staking and voting on Politeia proposals. This set of early miners overlaps with the other sets to some degree. Since the start of 2018 newly activating miners who stake DCR (within the same easily associated cluster of addresses) rarely vote on Politeia proposals.
These are only an initial simplified look at the DCR source data, the amount from a known source should be considered in relation to the total amount of DCR which came to the cluster, a large proportion of which may be from unknown sources. Specifically this analysis probably classifies a lot of participants as “PoW miners” because they mined a little DCR at some stage, but it may not be their primary method of acquiring DCR.
There was only one cluster with founder rewards still active in block 525,000 so I’m not going to chart them or single them out.
Some interesting clusters
Looking at the historical data for clusters, there are a few which stand out as unusual. I have seen a lot of unusual clusters doing this work, and most of the time they turned out to be artefacts of the clustering process and signs that something was wrong. However, since putting extensive effort into understanding the weak points of the clustering I am more comfortable to interpret these unusual clusters as probably reflecting real users.
DsS5puNw
This one stands out for the large airdrop hop1 amount (92,730 DCR), which implies that around 329 airdrops (282 DCR each) all ended up going into the same wallet, which in turn implies fairly heavy abuse of the airdrop by some party. Complicating this picture still further is 25,734 DCR which it received directly from the Treasury, suggesting that maybe the same parties that abused the airdrop may have been able to get some payouts from the Treasury too. Mining was a larger source still for this cluster, 682,334 DCR came to the cluster’s addresses 1 hop from mining rewards.
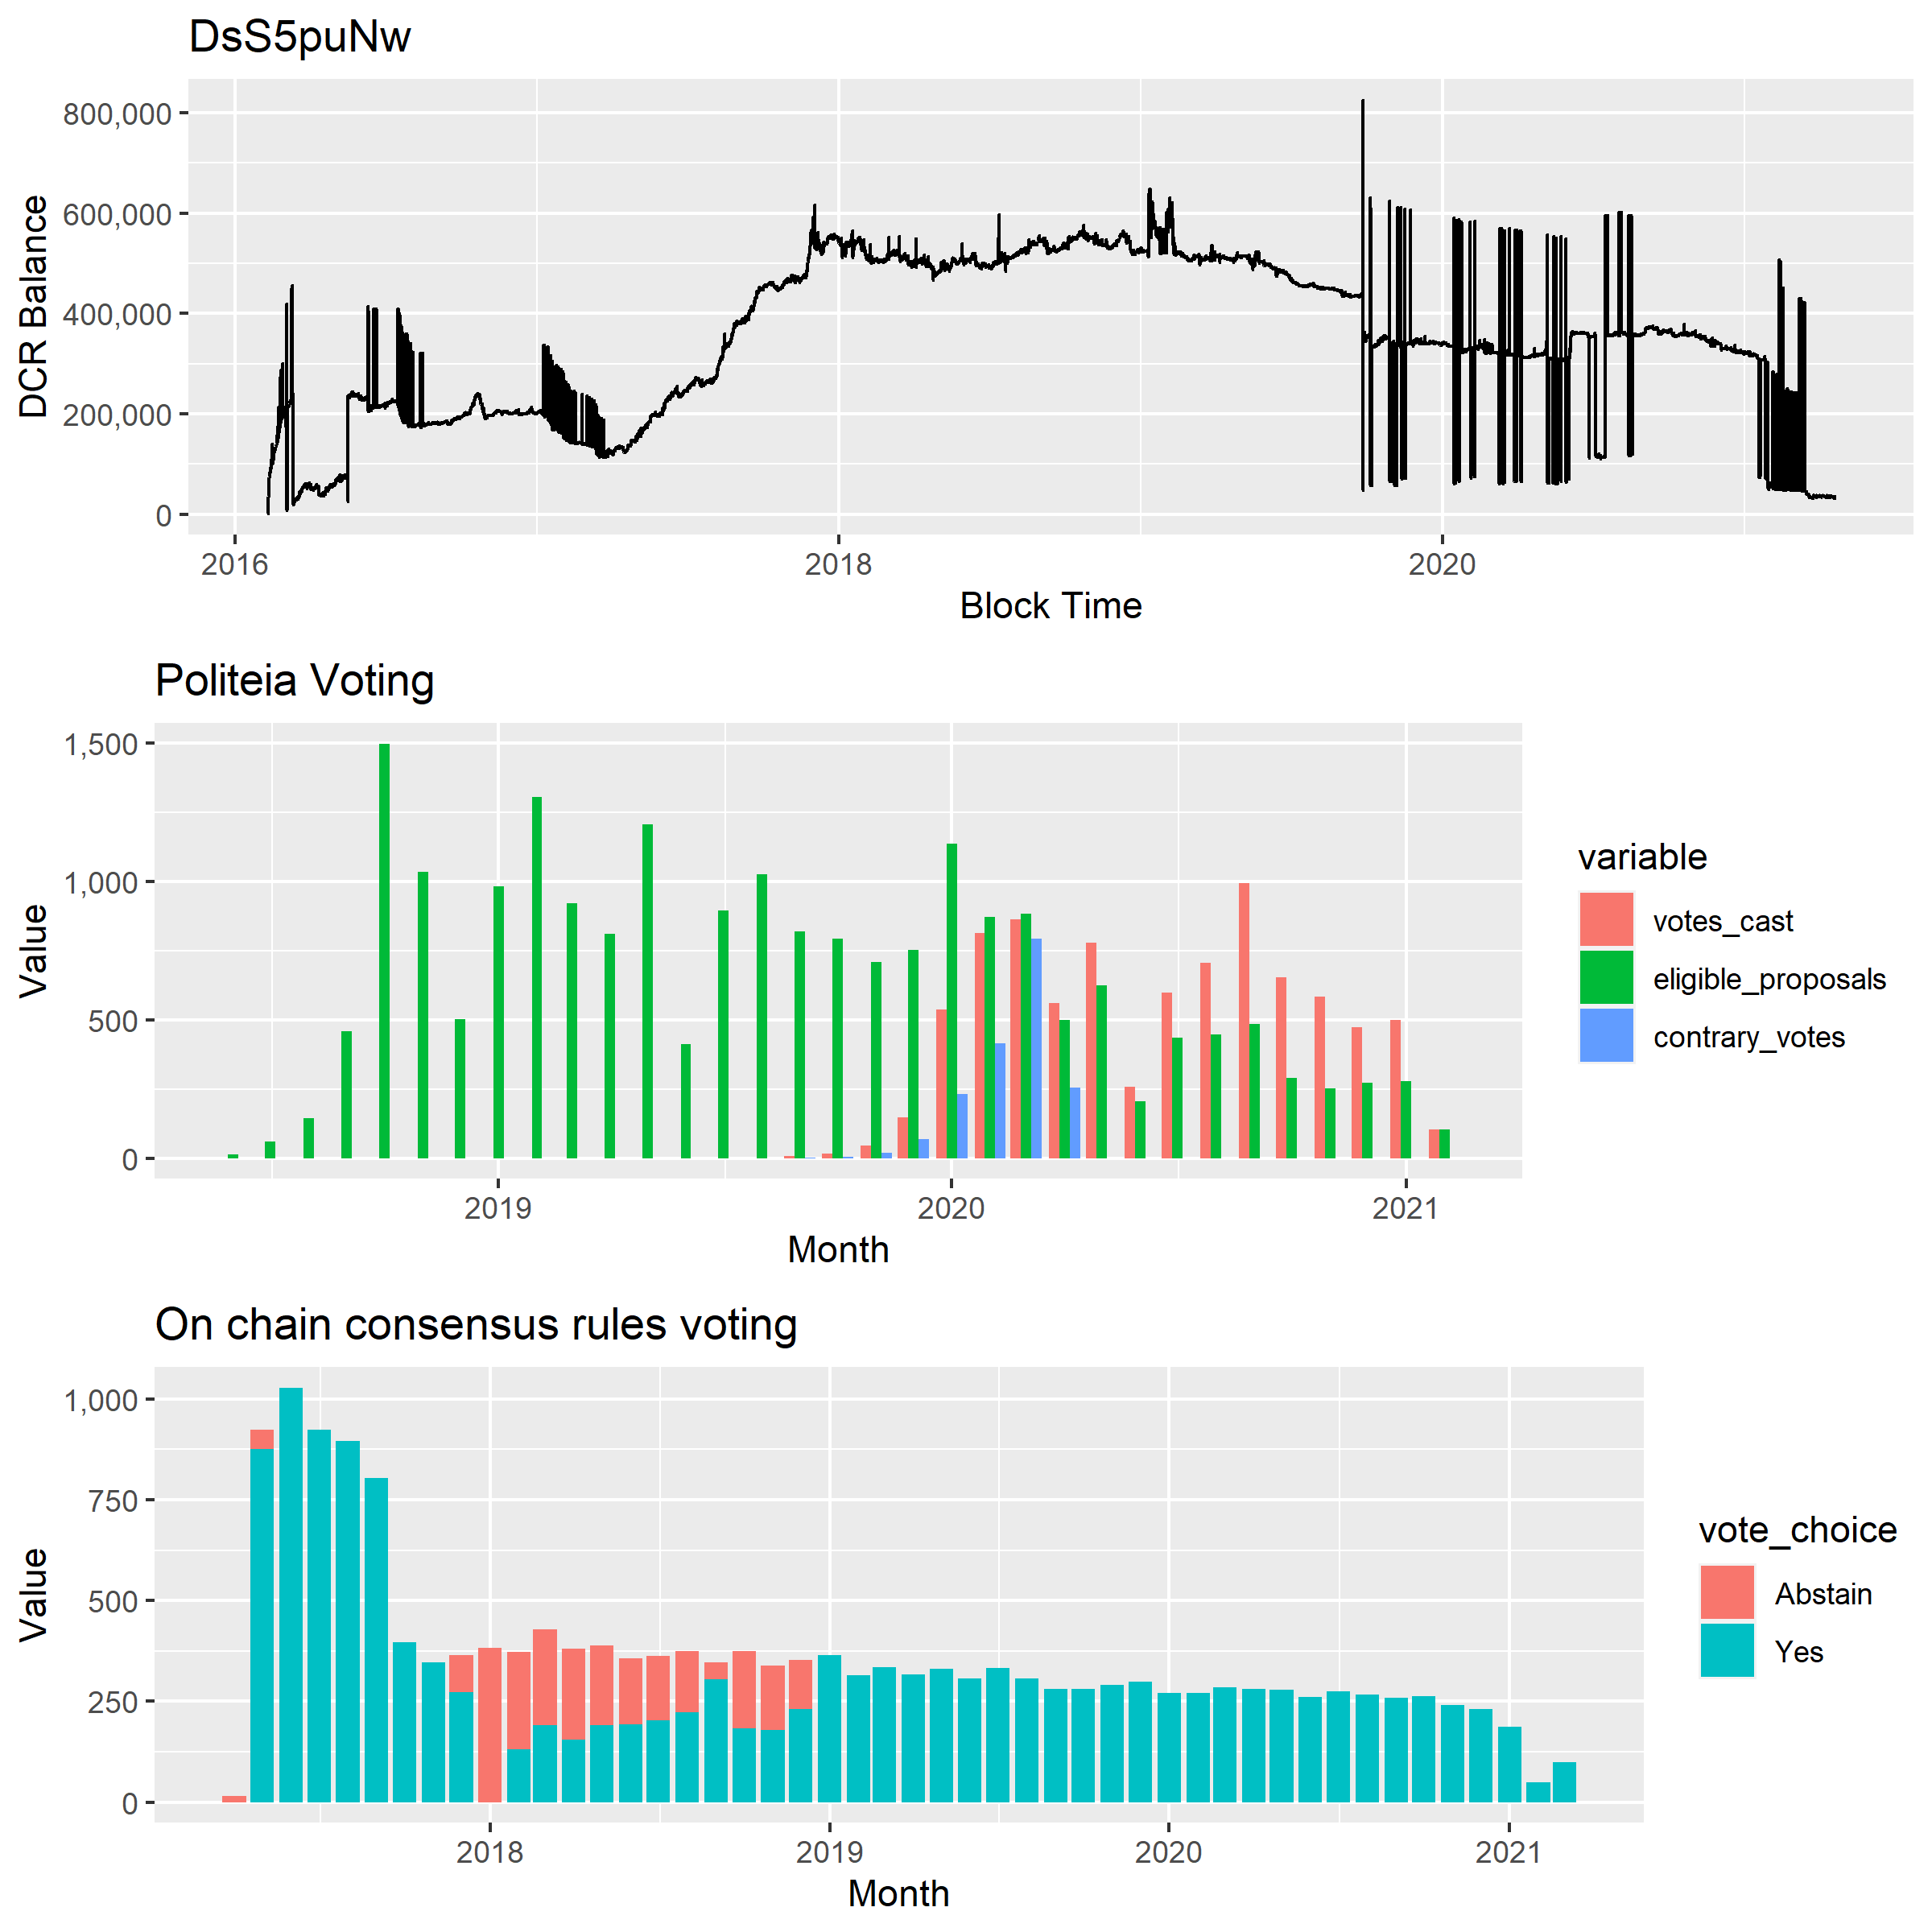
Balance and voting history for DsS5puNw cluster
This cluster had 86,411 tickets over the years, voting 72,848 times. One unusual aspect of this cluster’s voting behavior is the No voting on agenda proposals in 2017 (alongside tickets that voted yes and abstained on the same proposal). The Politeia voting record below looks consistent and not trollish, so I suspect that this cluster suffers from merging the early users of a VSP with the operator of that VSP into one big cluster. In this case by the time the Politeia proposals started in Oct 2018 it seems like maybe only one of the cluster’s components was still active so the contradictory voting issue did not appear.
Politeia voting history for DsS5puNw cluster
I am interested in how the 329 airdrops worth of DCR ended up in this cluster, but with the likelihood of some issues with merging users it seems less likely now that the same user obtained payments from the Treasury - more likely they both used/operated the same stakepool.
I isolated the airdrop reward address hits to look into where these funds were coming from manually, sorting by address there are immediately some stand-out examples of airdrop abuse. Let’s explore the first one, Dsf9SCZdvQ8fEX91fyxjPYA4MkQuX9B63vR. Every one of its 26 inputs is a transaction for 282.56 from an airdrop address, with the remainder being split off into a change address. At hop 2 the pattern becomes more elaborate with transactions with larger and more randomised amounts arriving at addresses like Dsi1xTMwqyRXdvDChg53fdSPKzhdZuP183s, but if you follow the inputs back they’re mostly or even exclusively coming from a lot of different airdrop addresses.
I would say most of the airdrops which went to this cluster’s addresses have been gamed, but I’m not sure if it’s one or multiple entities who were ripping off the airdrop - they could be blurred together if they subsequently used the same stakepool at an early time where I can’t reliably differentiate stakepool users/operators.
The treasury payouts ending up in this cluster also merited a closer look as they may be clues to some issue with the clustering. The first thing to note is that addresses receiving payments from the Treasury directly do not belong to the cluster, but there are fairly regular payments from addresses receiving Treasury funds to addresses associated with this cluster. These treasury payments go back to July 2016 and up to at least 2019, and they have been flowing to addresses operated by this cluster since at least February 2017.
It is important to note that I am not suggesting a long term Decred contractor ripped off the airdrop for 93,000 DCR, it is probably more likely that the airdrop abuser(s) and a Decred contractor have been mixed into the same erroneous cluster, but only one party (the contractor I guess) ever voted with tickets on Politeia proposals. That’s why I am not publishing any details of the contractor-associated addresses or transactions in this cluster. I included addresses for the airdrop abuse because it’s more clear to me that something shady is going on there. Also worth noting that by block 525,000 they were down to just 214 live tickets, so they have scaled down their presence quite a bit - balance is down to 47,500 from a maximum of 880,000 (may merge multiple users).
I followed up by re-clustering from the Dsf9S address which received 26+ airdrops and that cluster does not connect to the voting record above - that association must be introduced from a different starting point. However, this run of the clustering showed big hits for airdrop DCR (85,883 at hop 1), mined DCR (681,863 at hop 1) and also some Treasury DCR (23,951 at hop 1). There are only 3 tickets associated with this cluster, the link to all of those other tickets and the voting record above must be introduced from a different address starting point - and is therefore more likely to be erroneous.
This is still one of a number of clusters that I have doubts about and keep an eye on with each refinement of the clustering to see if it makes any more sense.
Dscqu
This cluster also picked up a few airdrops (14,131 airdrop DCR at hop 1) and has received a small amount of Treasury DCR (371) and also PoW mined 565 DCR.
Unlike the previous cluster, the airdrops in question this time were used to buy tickets rather than combined, so there aren’t easy to identify merge points where you can show that a lot of the funds were pooled. Nevertheless, my clustering code suggests that a lot of airdrop DCR ended up in addresses controlled by this cluster after being staked.
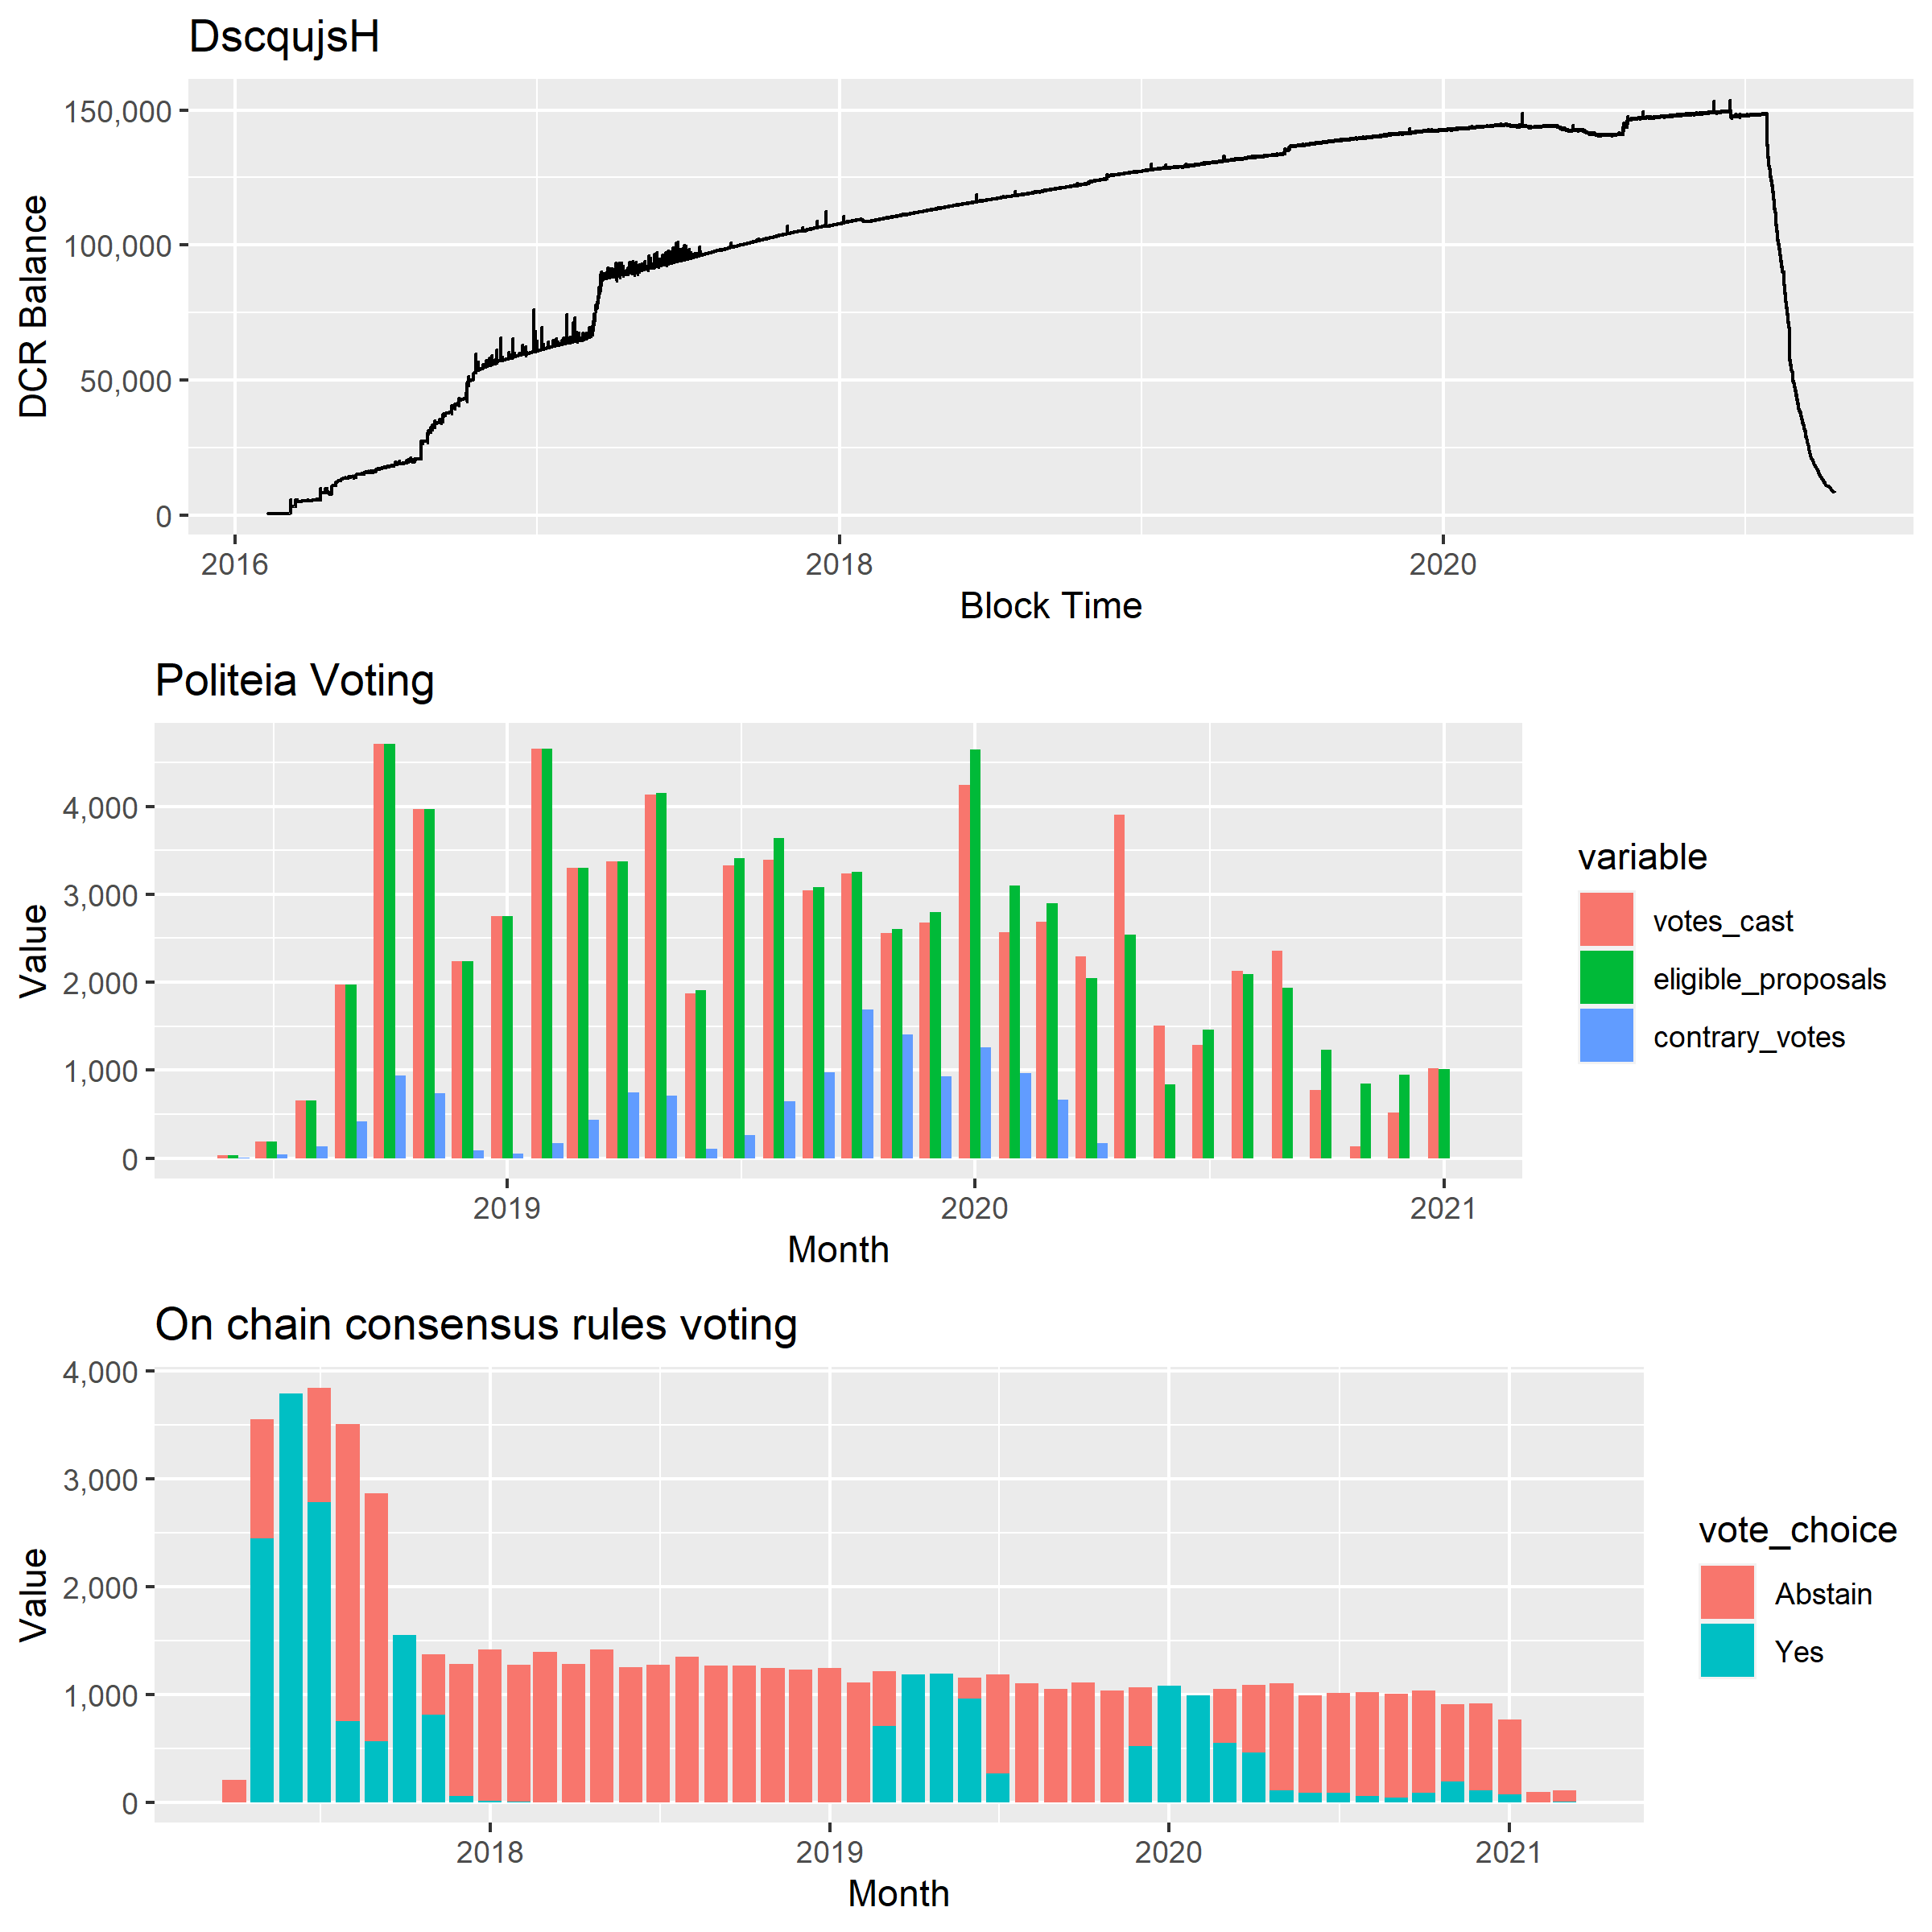
Balance and voting history for DscqujsH cluster
Since the time when Politeia launched this cluster appears as an actively engaged stakeholder with a high voting rate for Politeia proposals and on chain consensus votes.
DsSWT
This cluster has a lot of hop 0 mining rewards (520,000 DCR) and started in March 2018, so looks like a major ASIC miner or someone started running a mining pool in the timeframe. It behaves similarly to a lot of the miner points on the scatterplots above but it only dabbled with staking, bought 731 tickets, but didn’t vote at all on any of the consensus changes or Politeia proposals (0 from 1,517 opportunities).
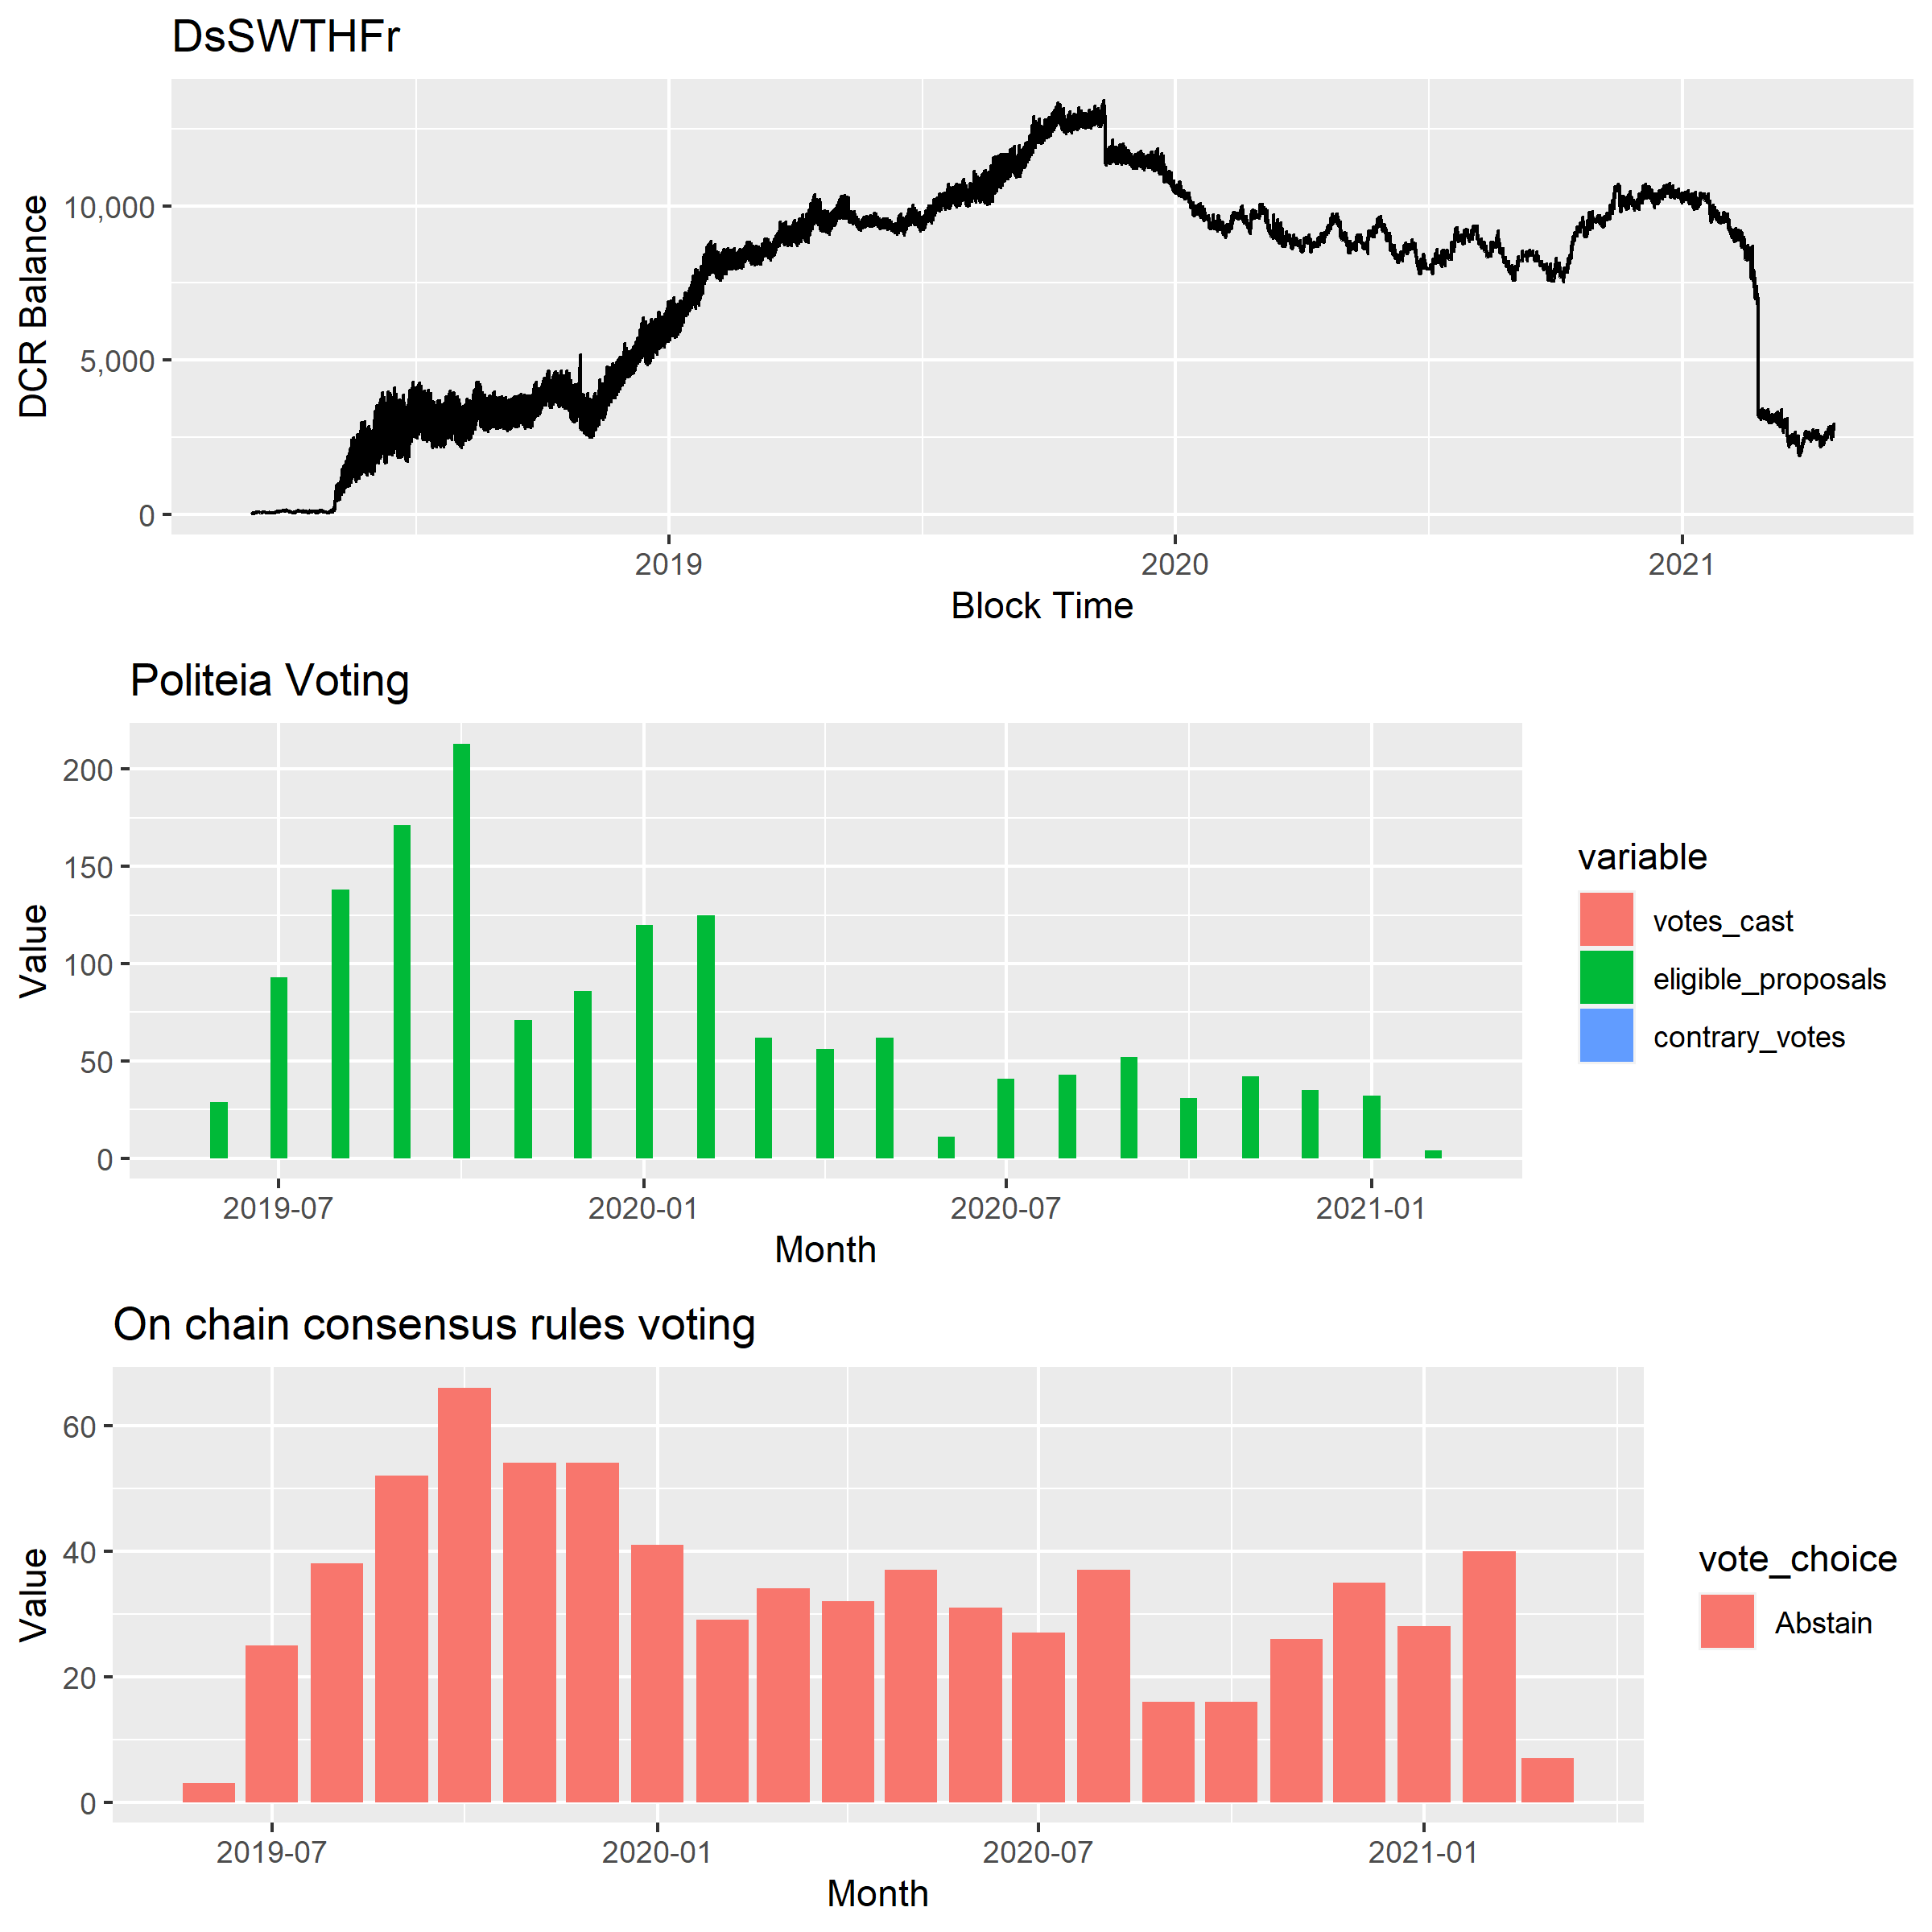
Balance and voting history for DsSWTHFr cluster
Dcrh8
One of the largest stakeholders in the block 525,000 unmixed ticket pool, Dcrh8 is also a longstanding stakeholder with 39,298 block ticket votes under their belt, earning a tidy 37,000 DCR in rewards. There are no hits for the sources of their DCR, and this cluster became active in Jan 2018.
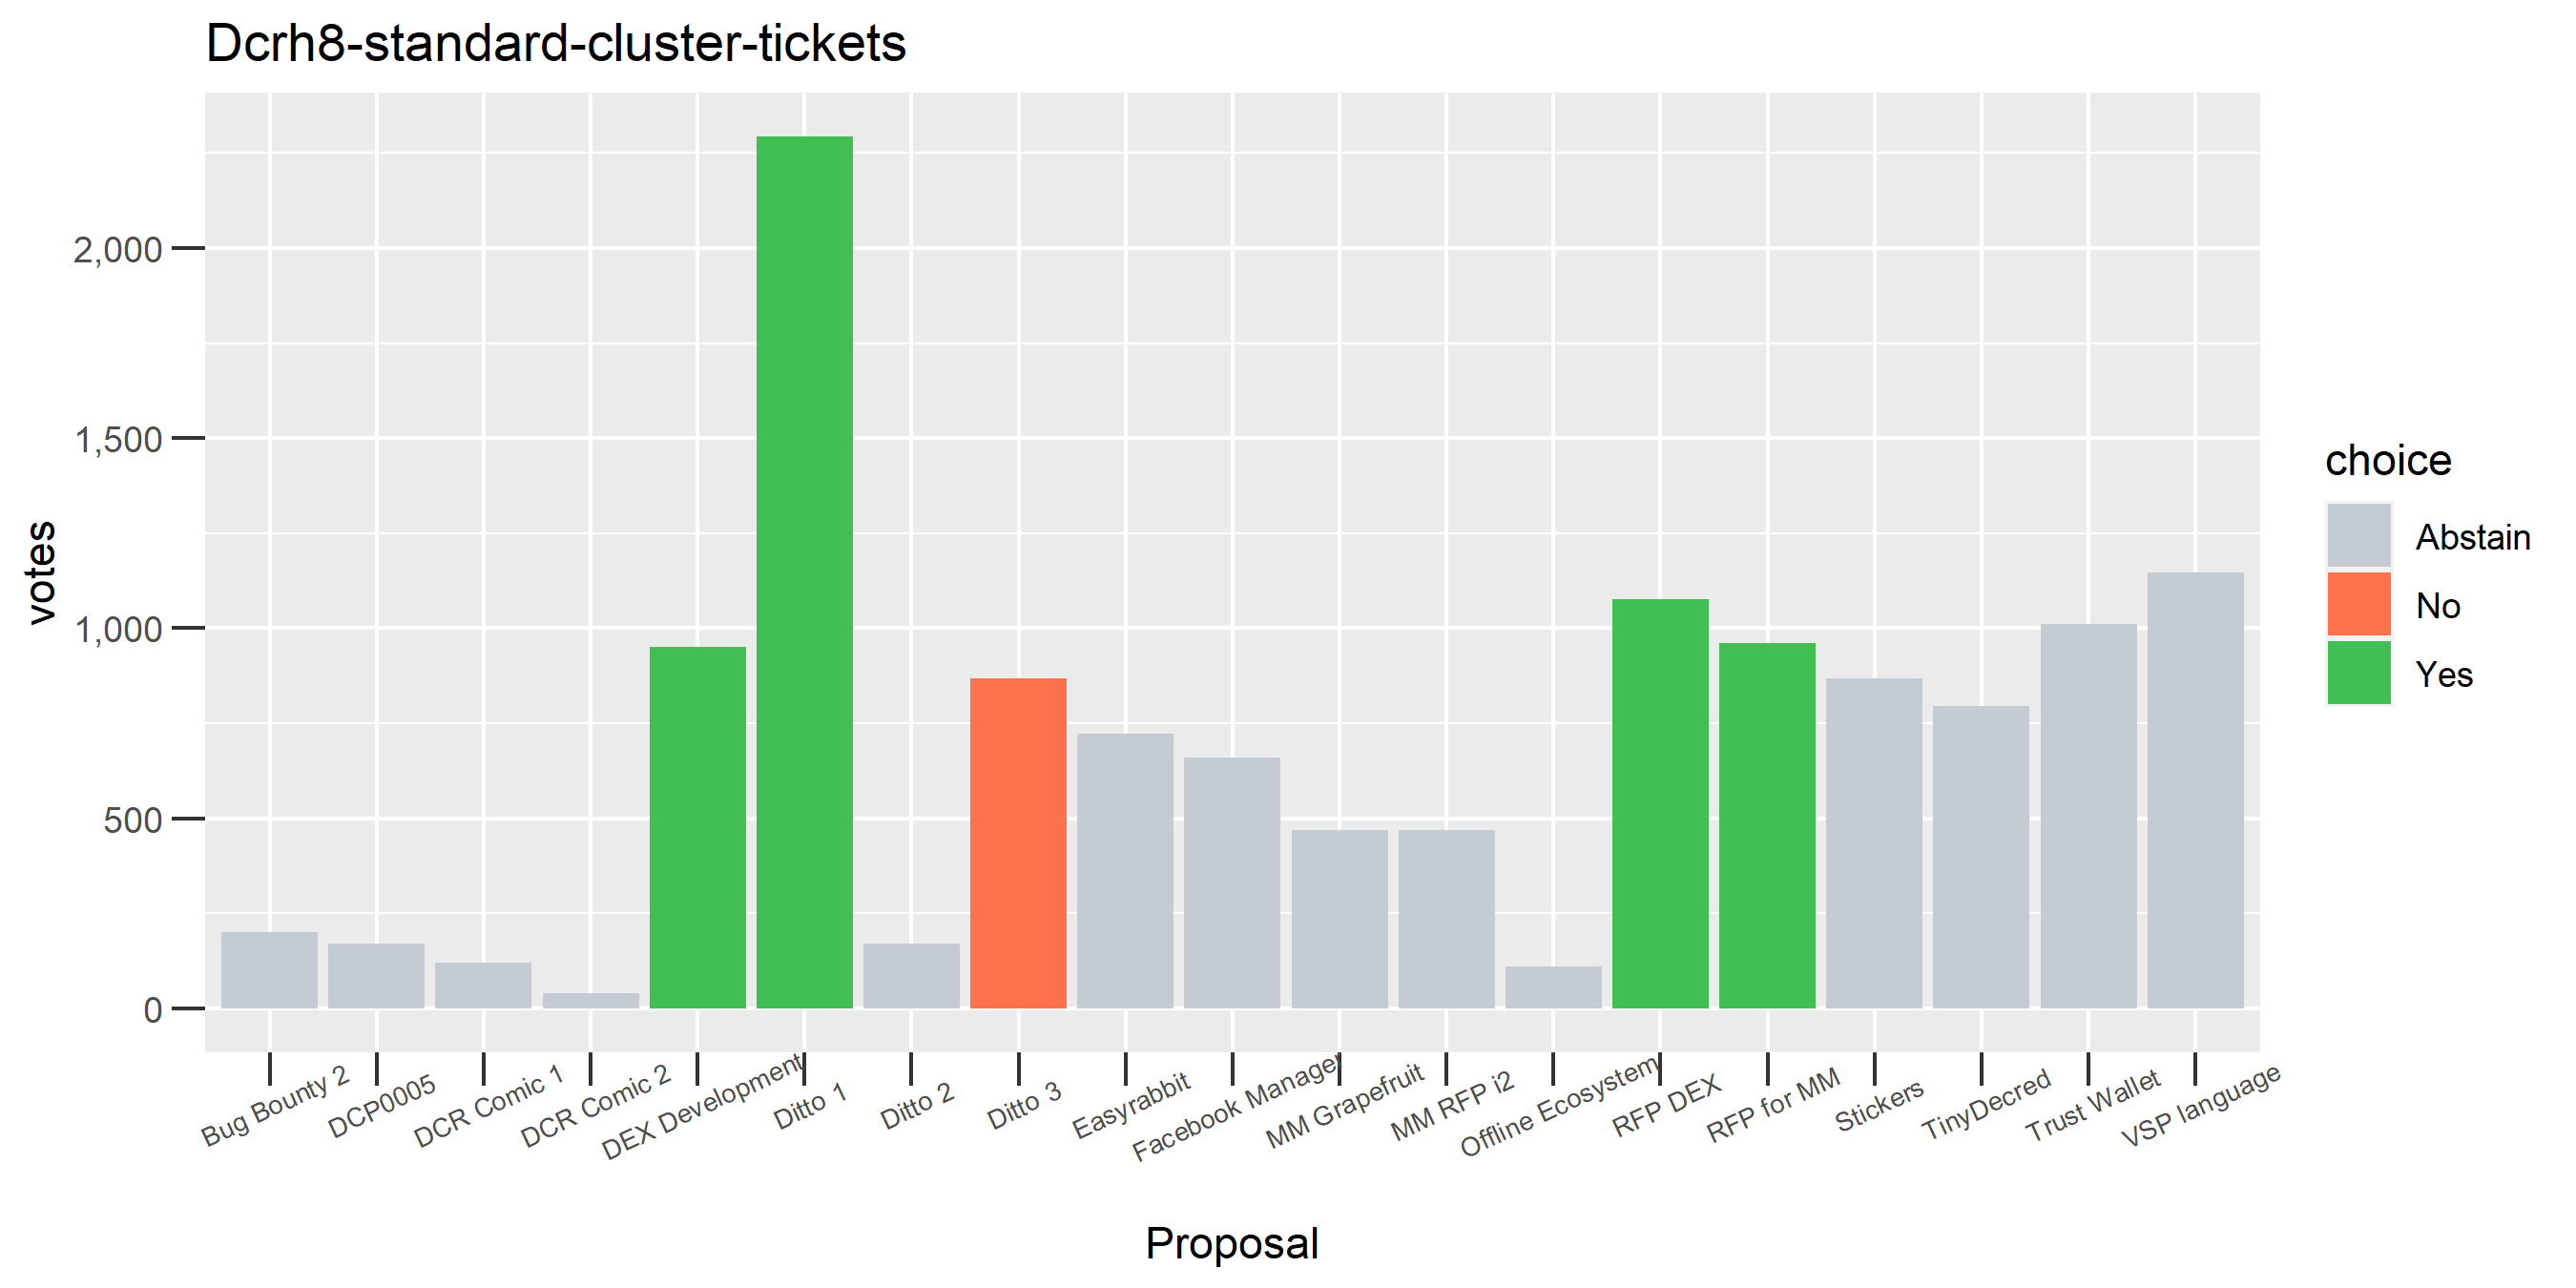
Politeia voting for the Dcrh8 cluster
The cluster only voted on proposals about DEX, Market Makers or Ditto. For most of the clusters there is very little to distinguish them except their voting record. Sometimes the voting record indicates a cluster’s affiliation (e.g. if the only Politeia proposals they ever voted on were supporting a specific market maker proposal) but most of the time it just gives an insight into what the stakeholder values in terms of Treasury spending.
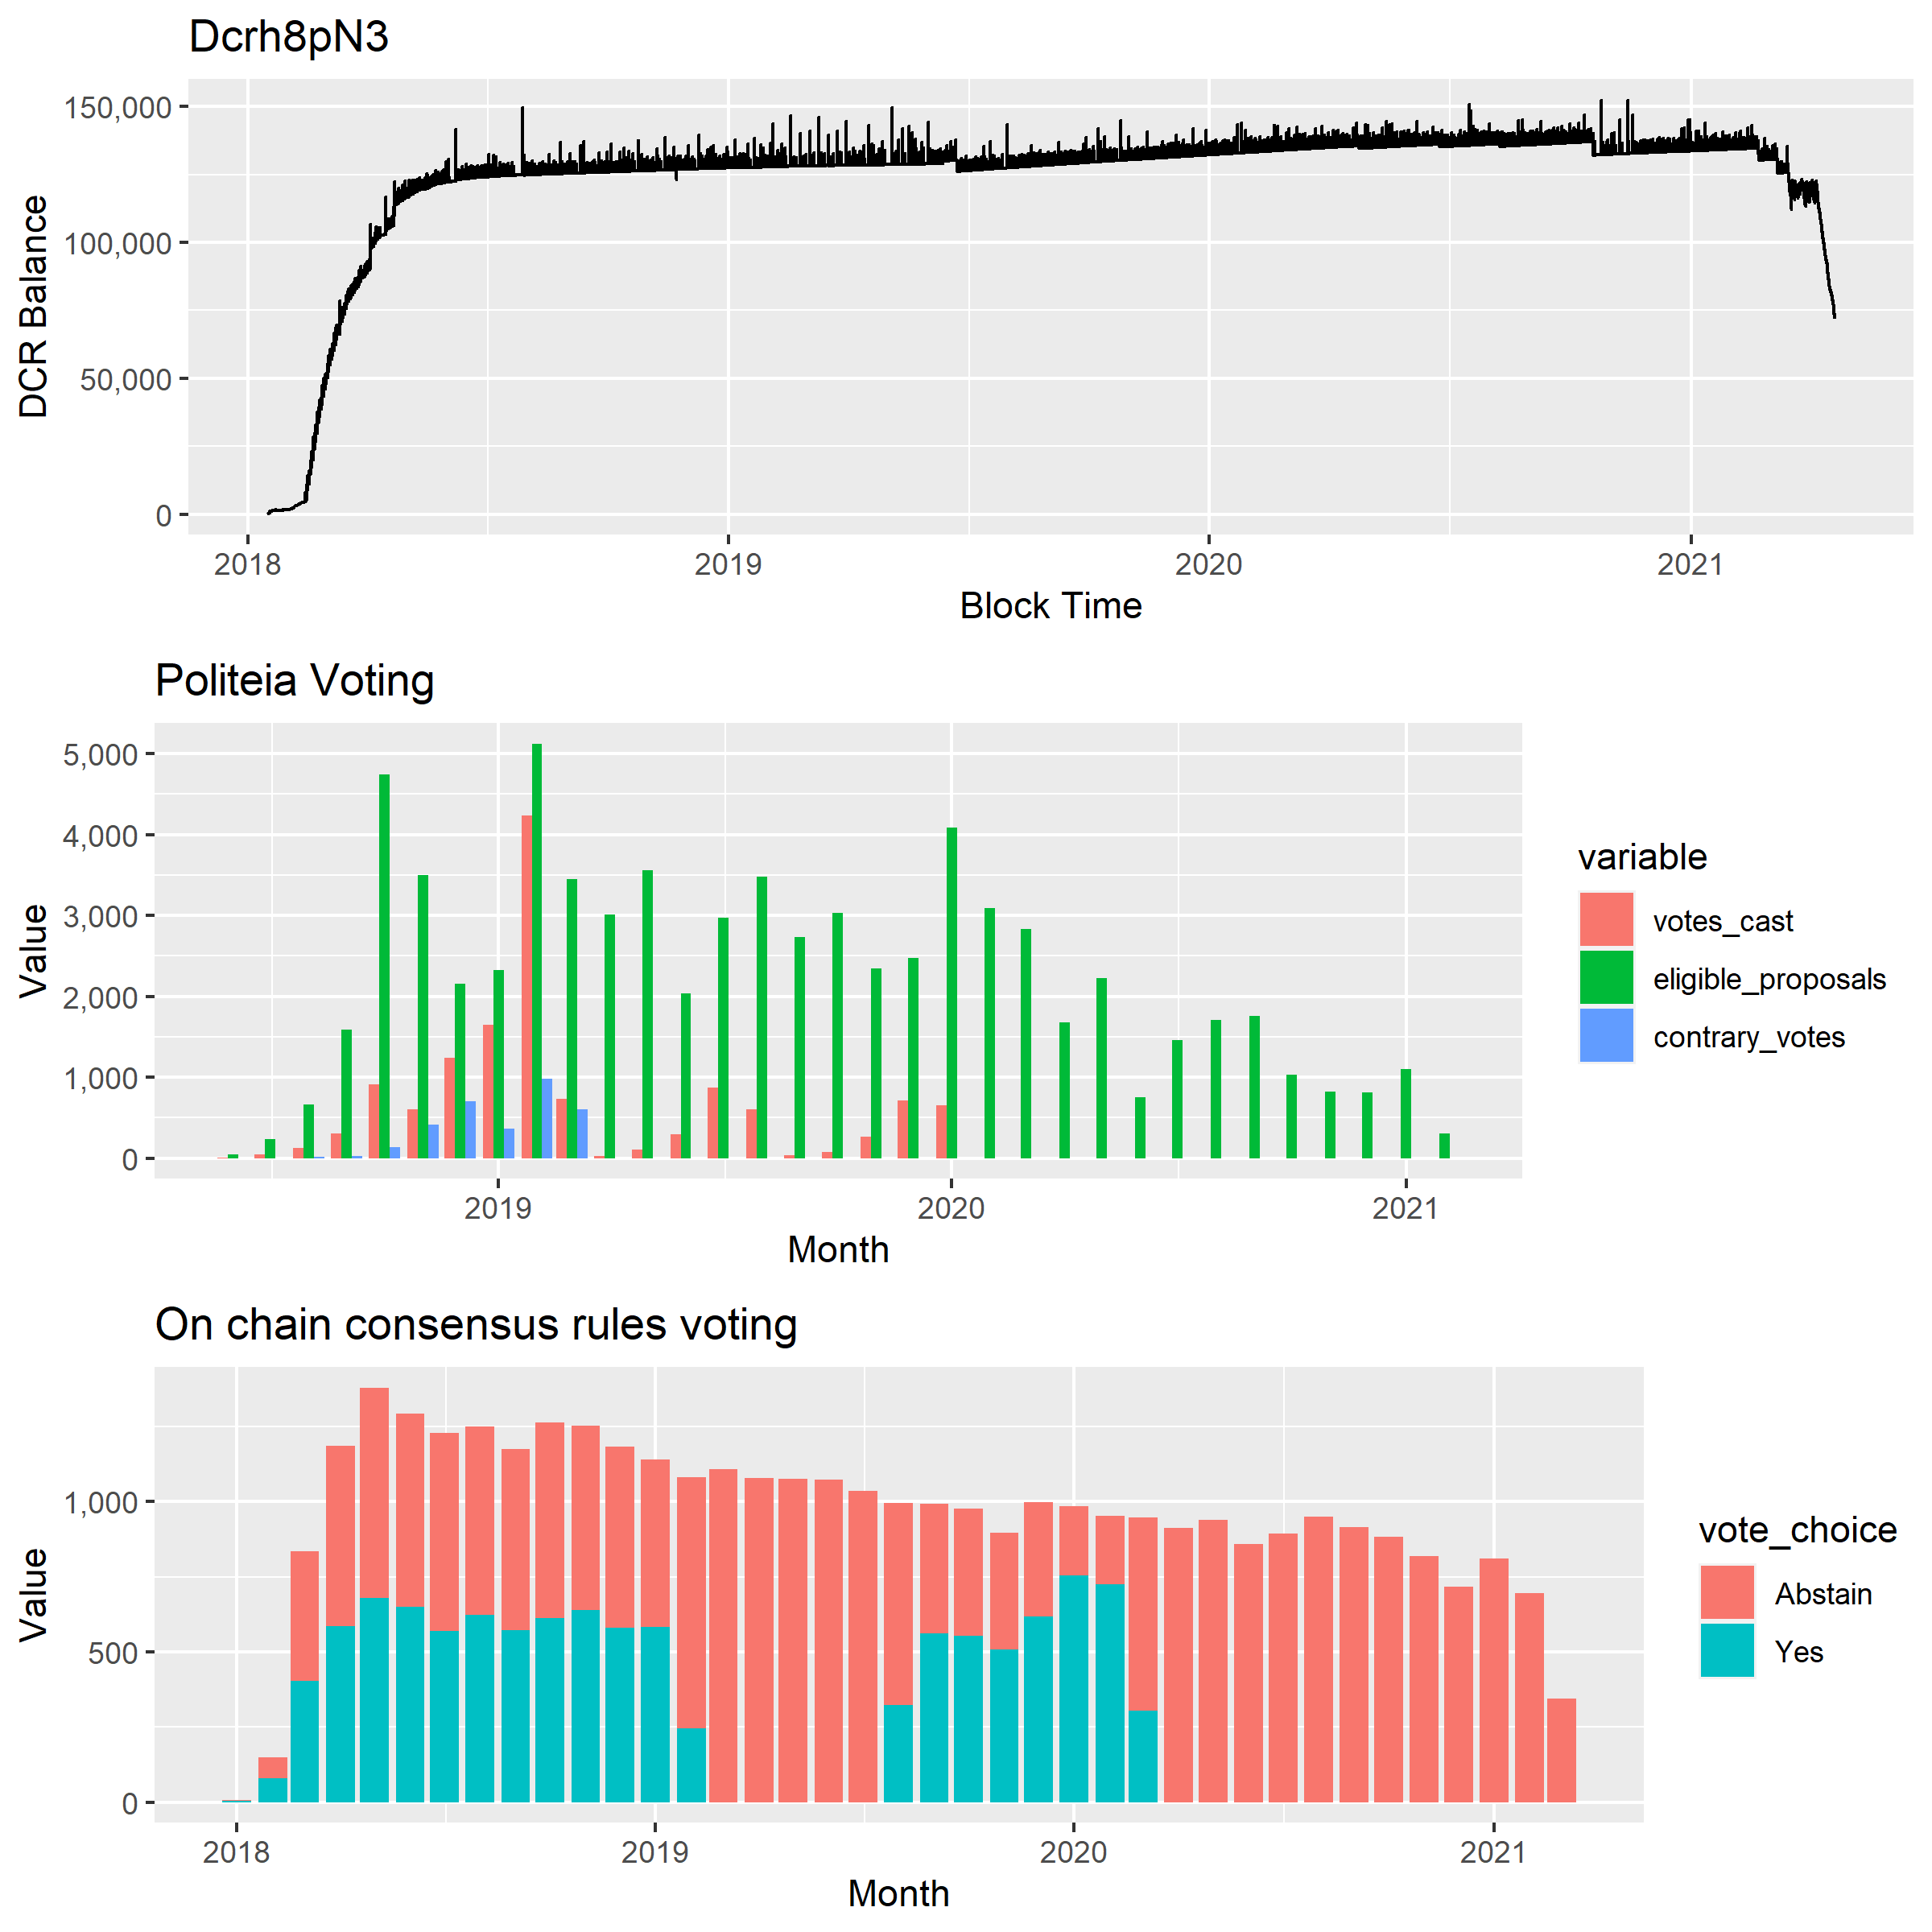
Dcrh8 cluster balance and voting record
The cluster seems to have disengaged from Politeia voting in late 2020 and then consensus voting, but kept buying tickets until a reduction near the end of the study period.
If you like the Politeia voting plots for clusters there are many more at the end of the clustering deep dive.
Next steps
- Look more closely at the early years of Decred blockchain history to further refine the approach to address clustering and understand its limitations.
- Explore further uses of the cluster-level data, and a way to explore manual association of clusters which seem highly likely to be related.
- Investigate the implications of frequent Politeia voting for stakeholder privacy.
- I’m open to suggestions about what would be interesting to look at next with the on chain data.