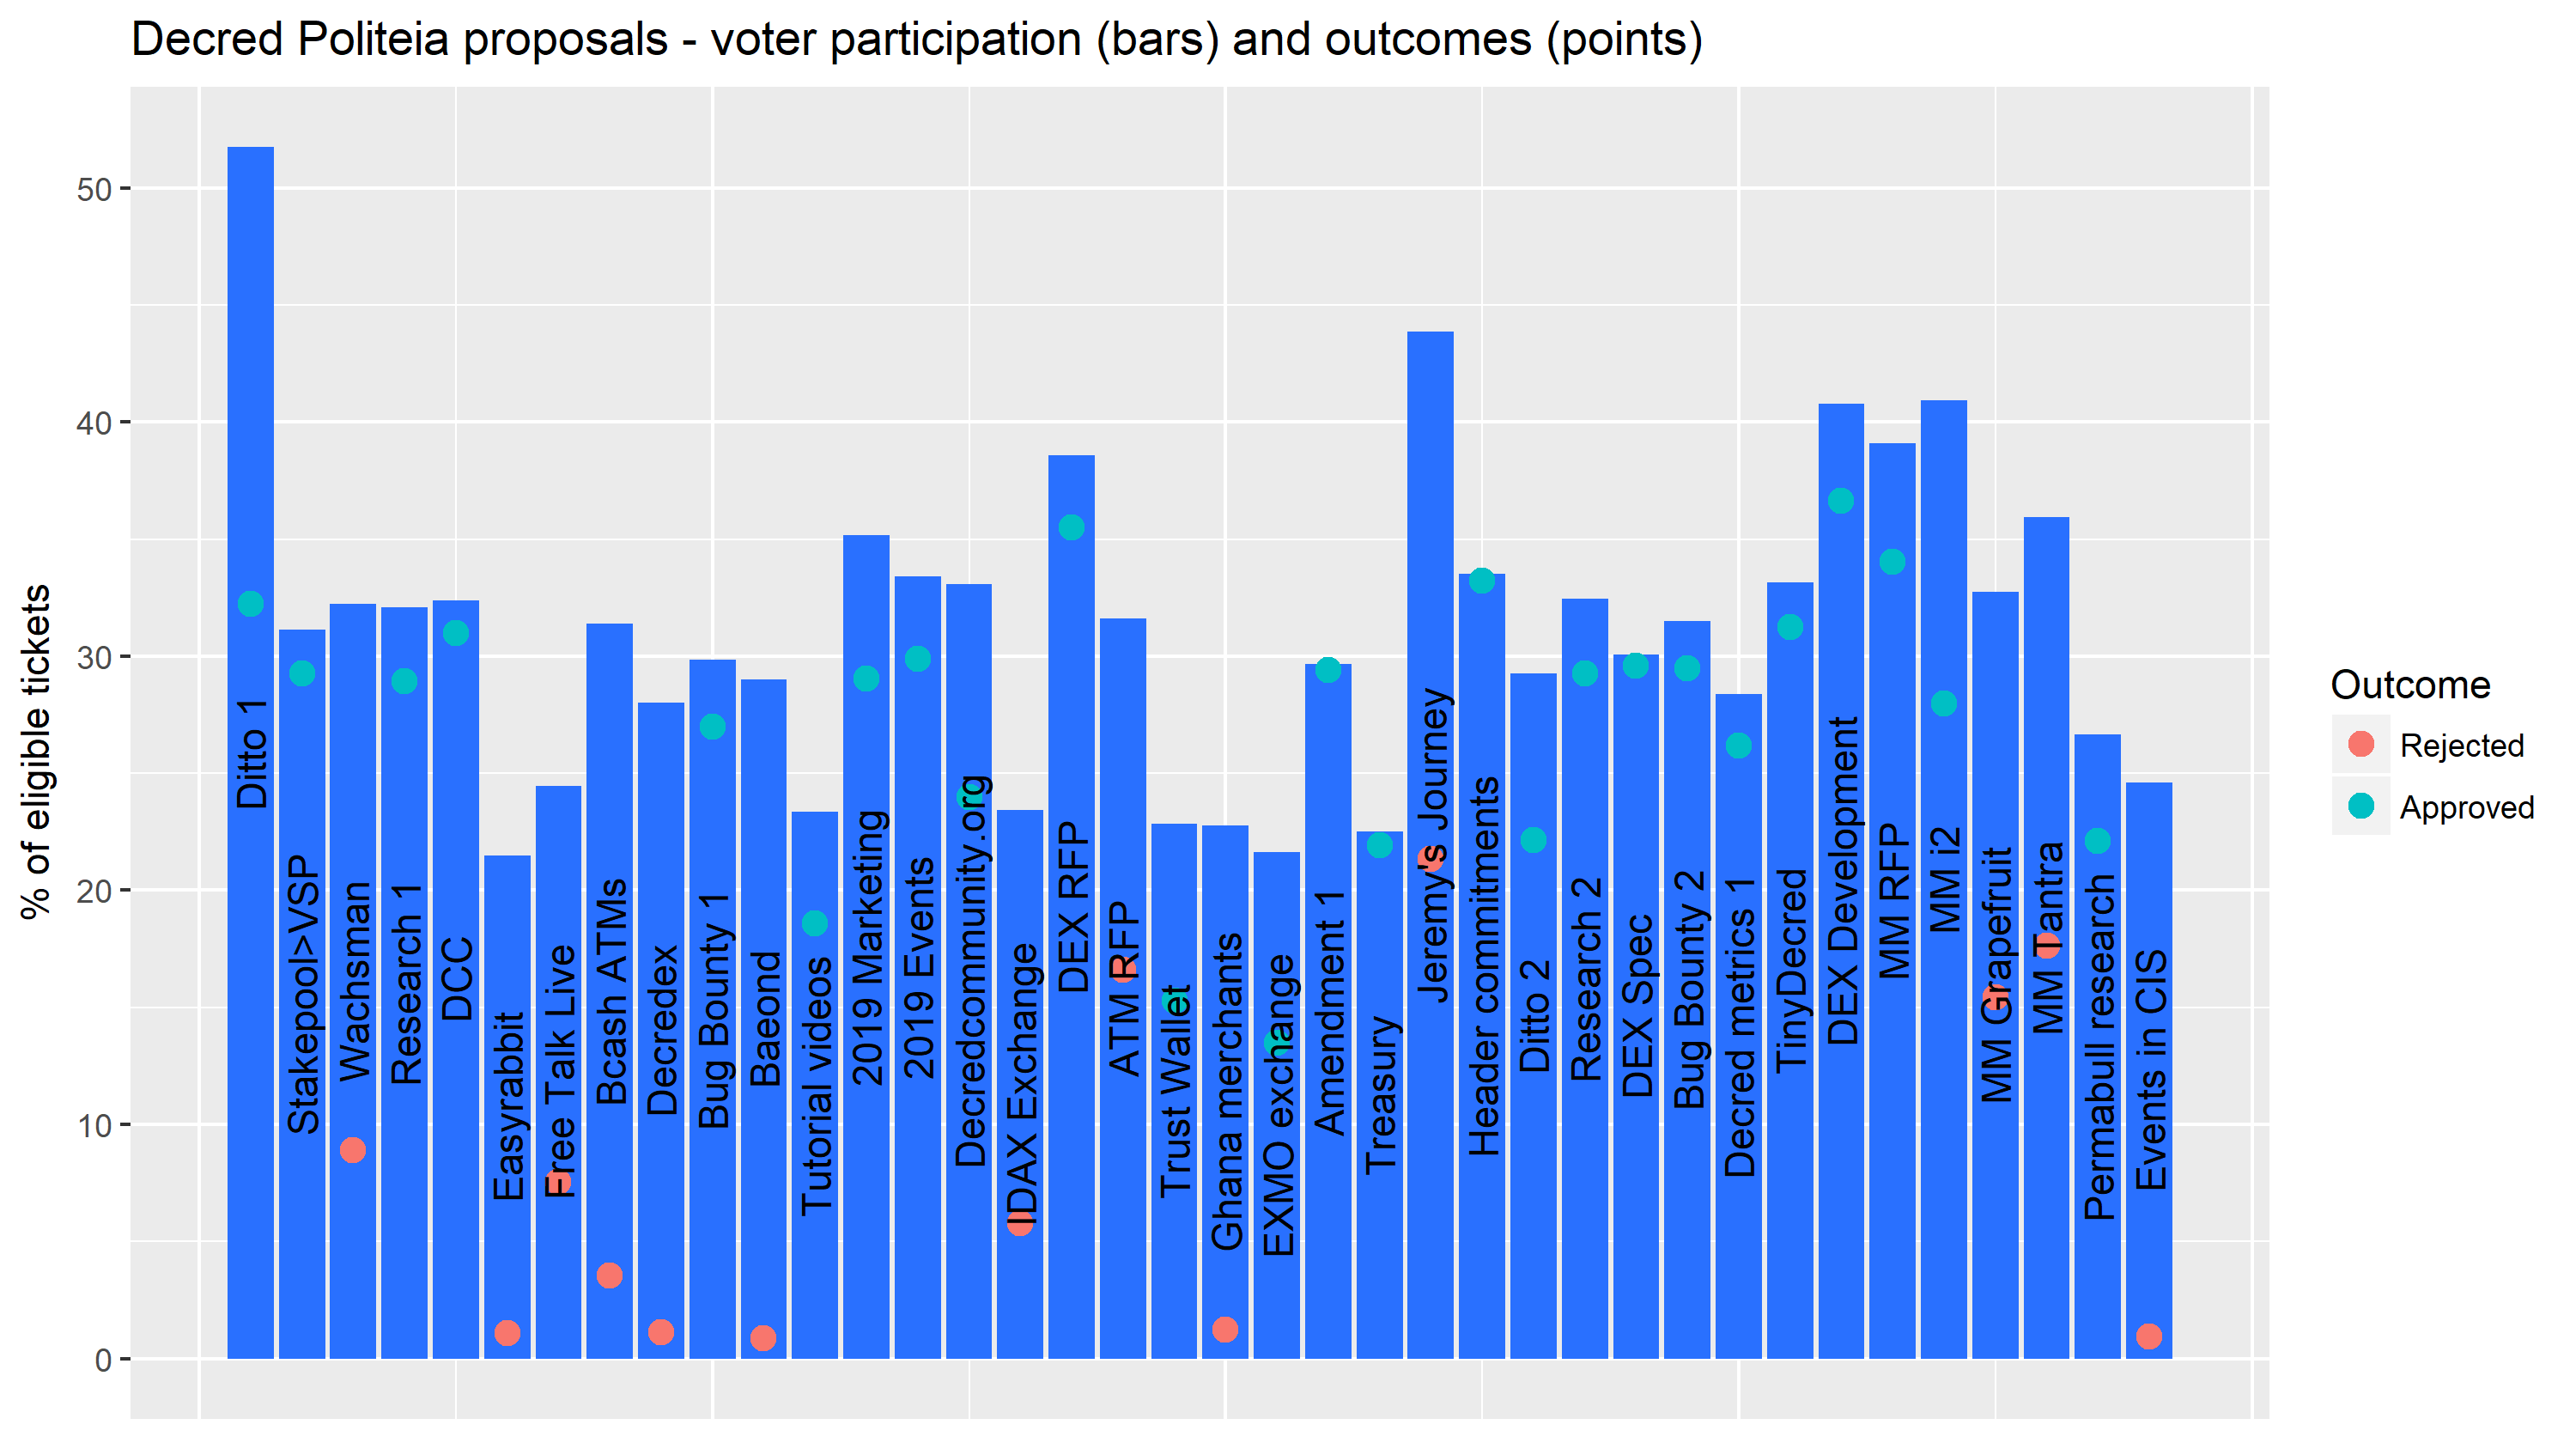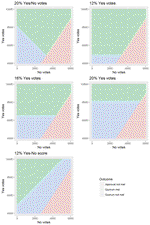
This project is about making use of the Politeia data repository to generate data-sets, statistics and visualizations which explore how Politeia is working and being used. Code and data are shared in the project repository, and the idea is that people can use this to check for themselves that the analysis as it is reported here is consistent with the timestamped public record of Politeia activity.
Starting with an understanding of how the data is stored, this project has produced code to process that data and a number of reports and visualizations which use it. Along the way the analyses have allowed a number of bugs with voting to be spotted and addressed promptly, and the data processing scripts have allowed aspects of Politeia Digest to be automated.
The following data-sets and statistics in the repository are updated fairly regularly:
- Proposal Voting Outcomes
- All Proposals
- Politeia User Activity
- Politeia Comments
- Politeia Comment Votes
- Politeia activity summary stats
For charts showing ticket voting over time check out dcrdata.


